The only perk of returning home from a cottage vacation is that I got to watch the season finale of Strange New Worlds. Great show! 🖖
The only perk of returning home from a cottage vacation is that I got to watch the season finale of Strange New Worlds. Great show! 🖖
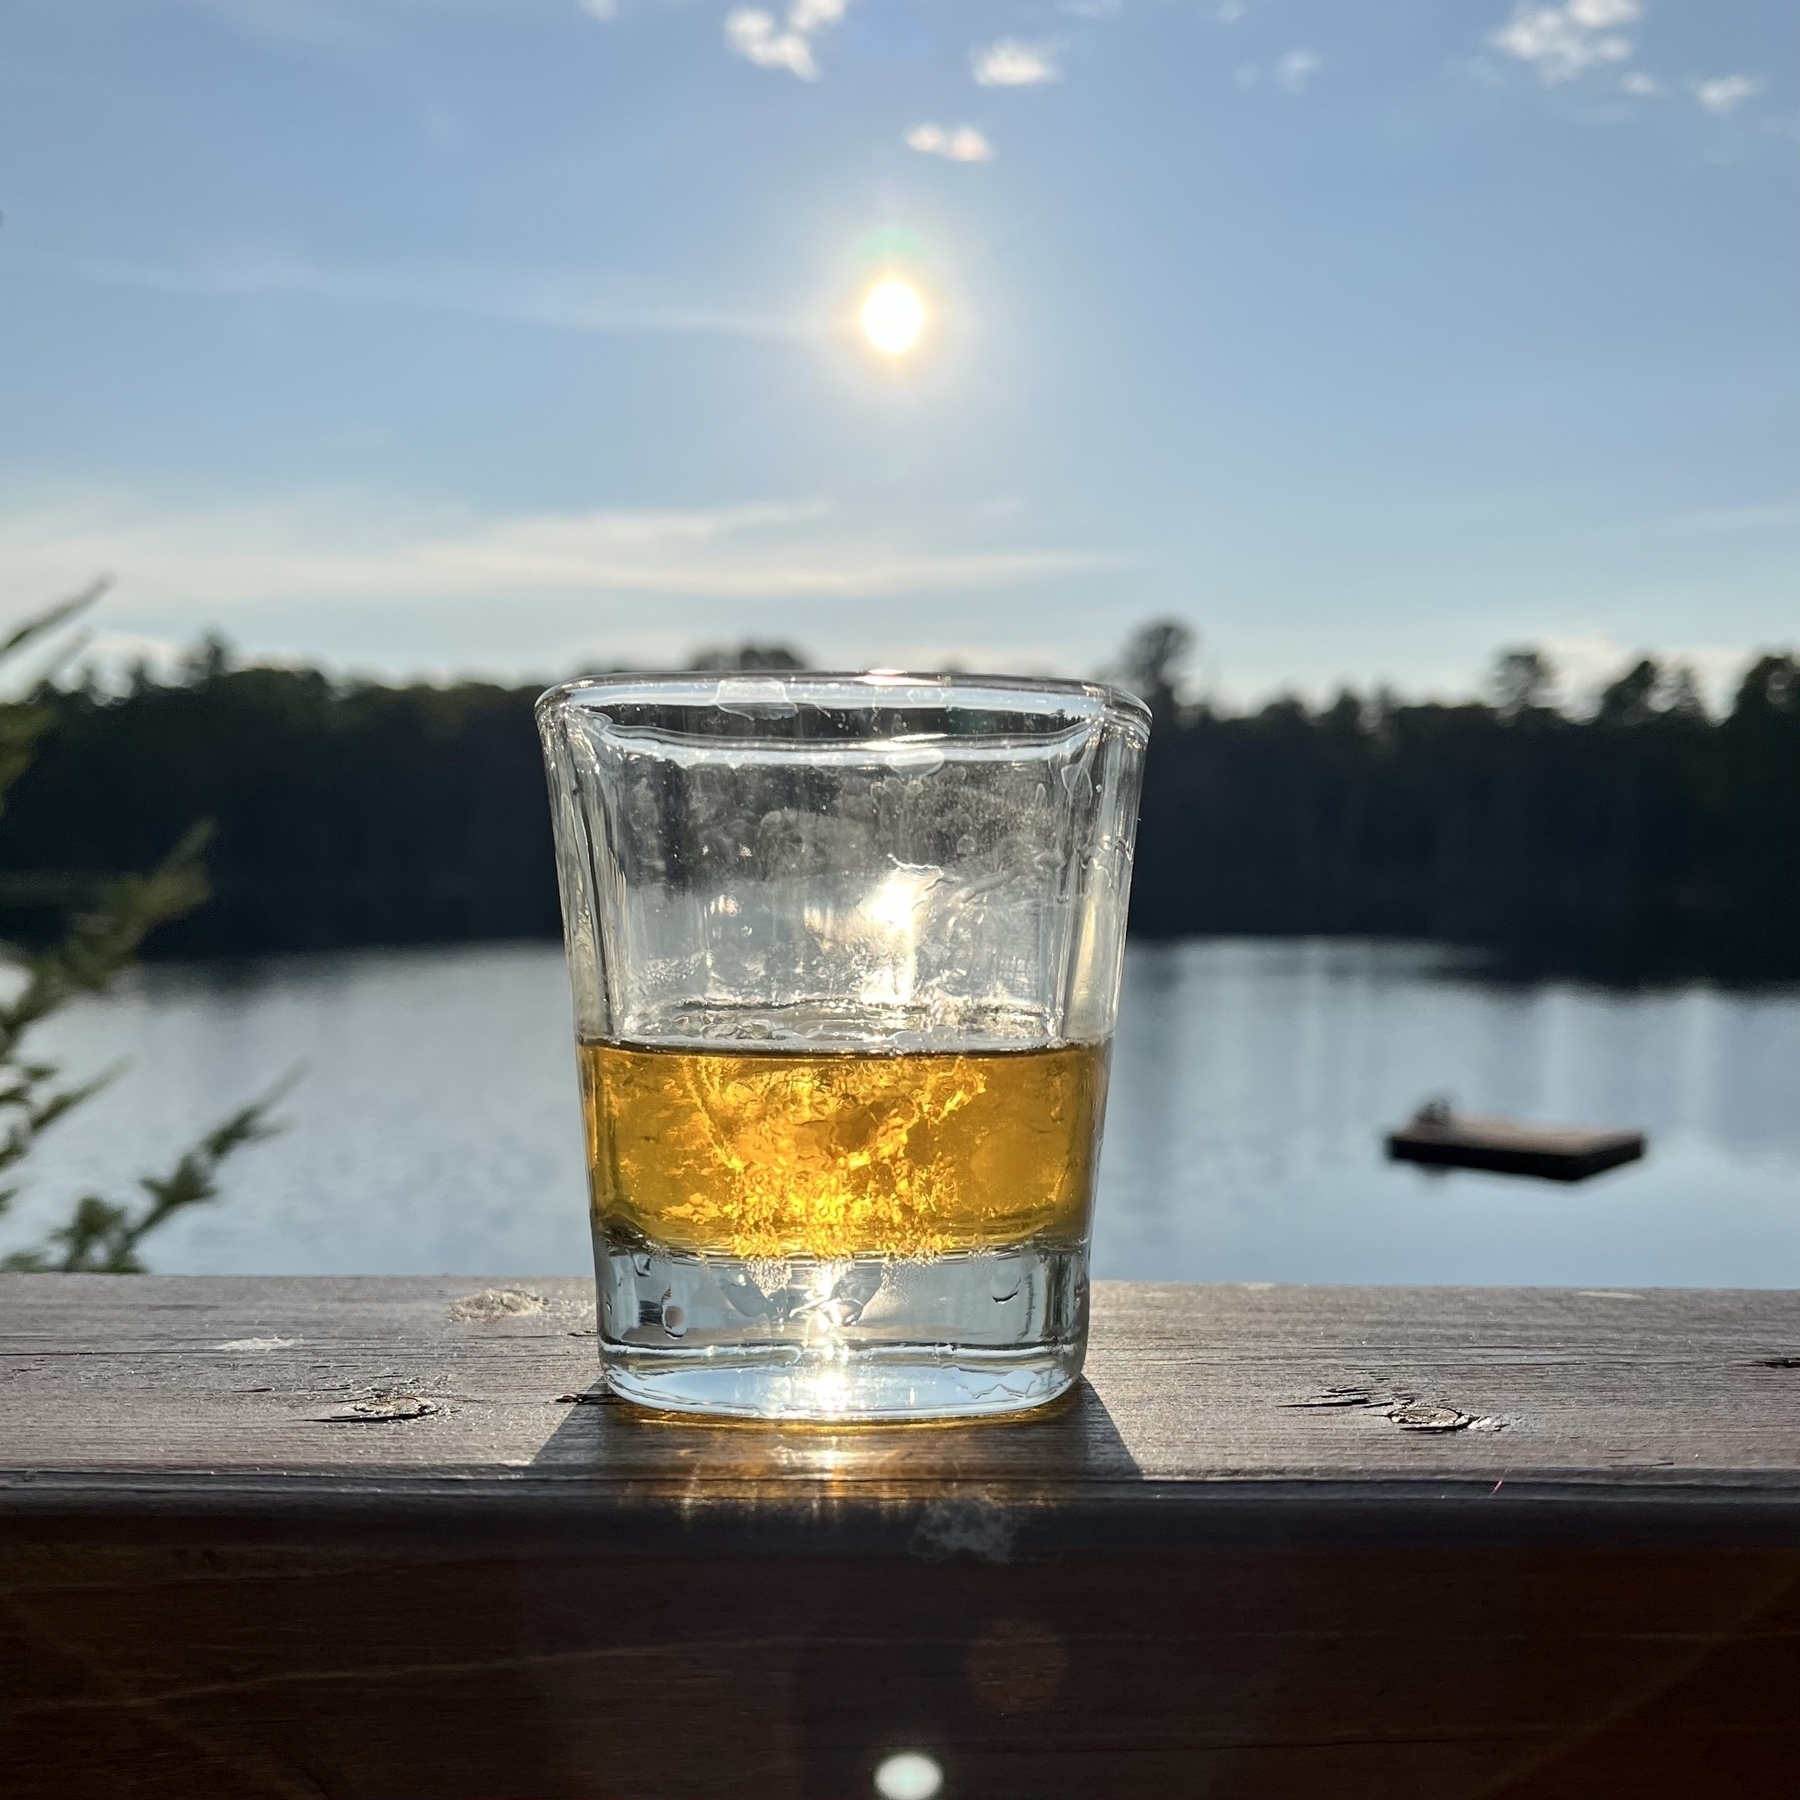
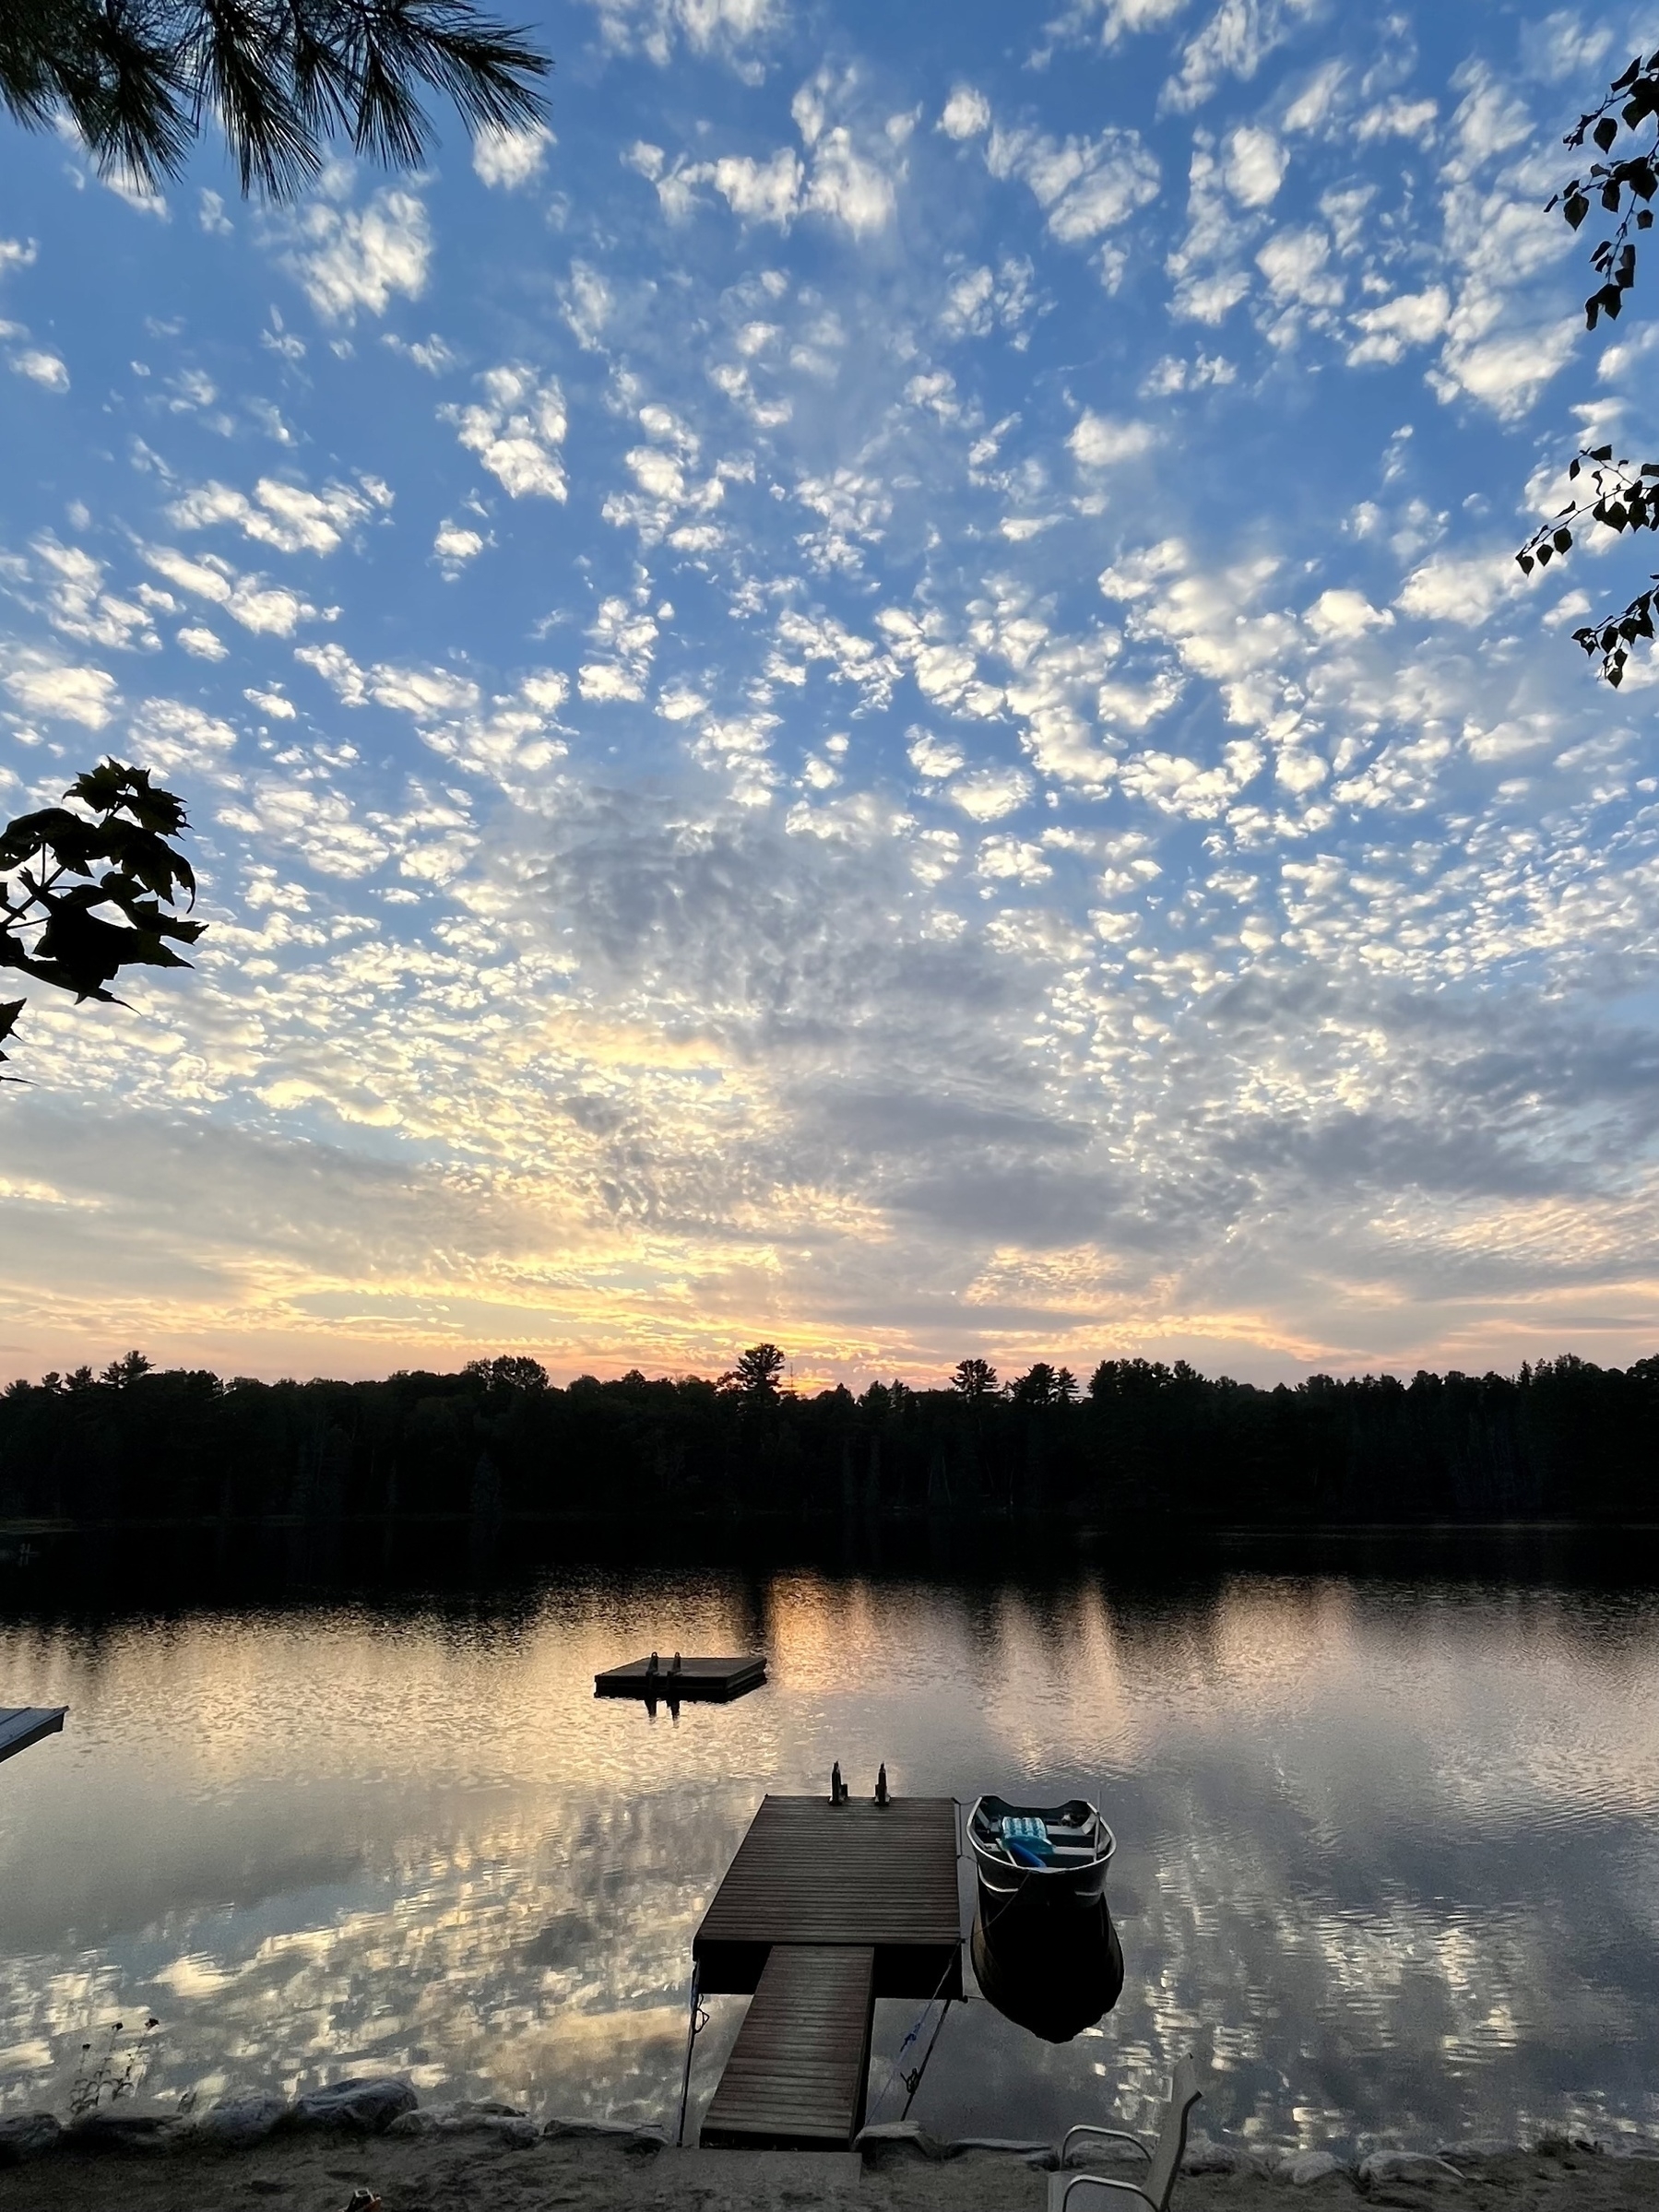
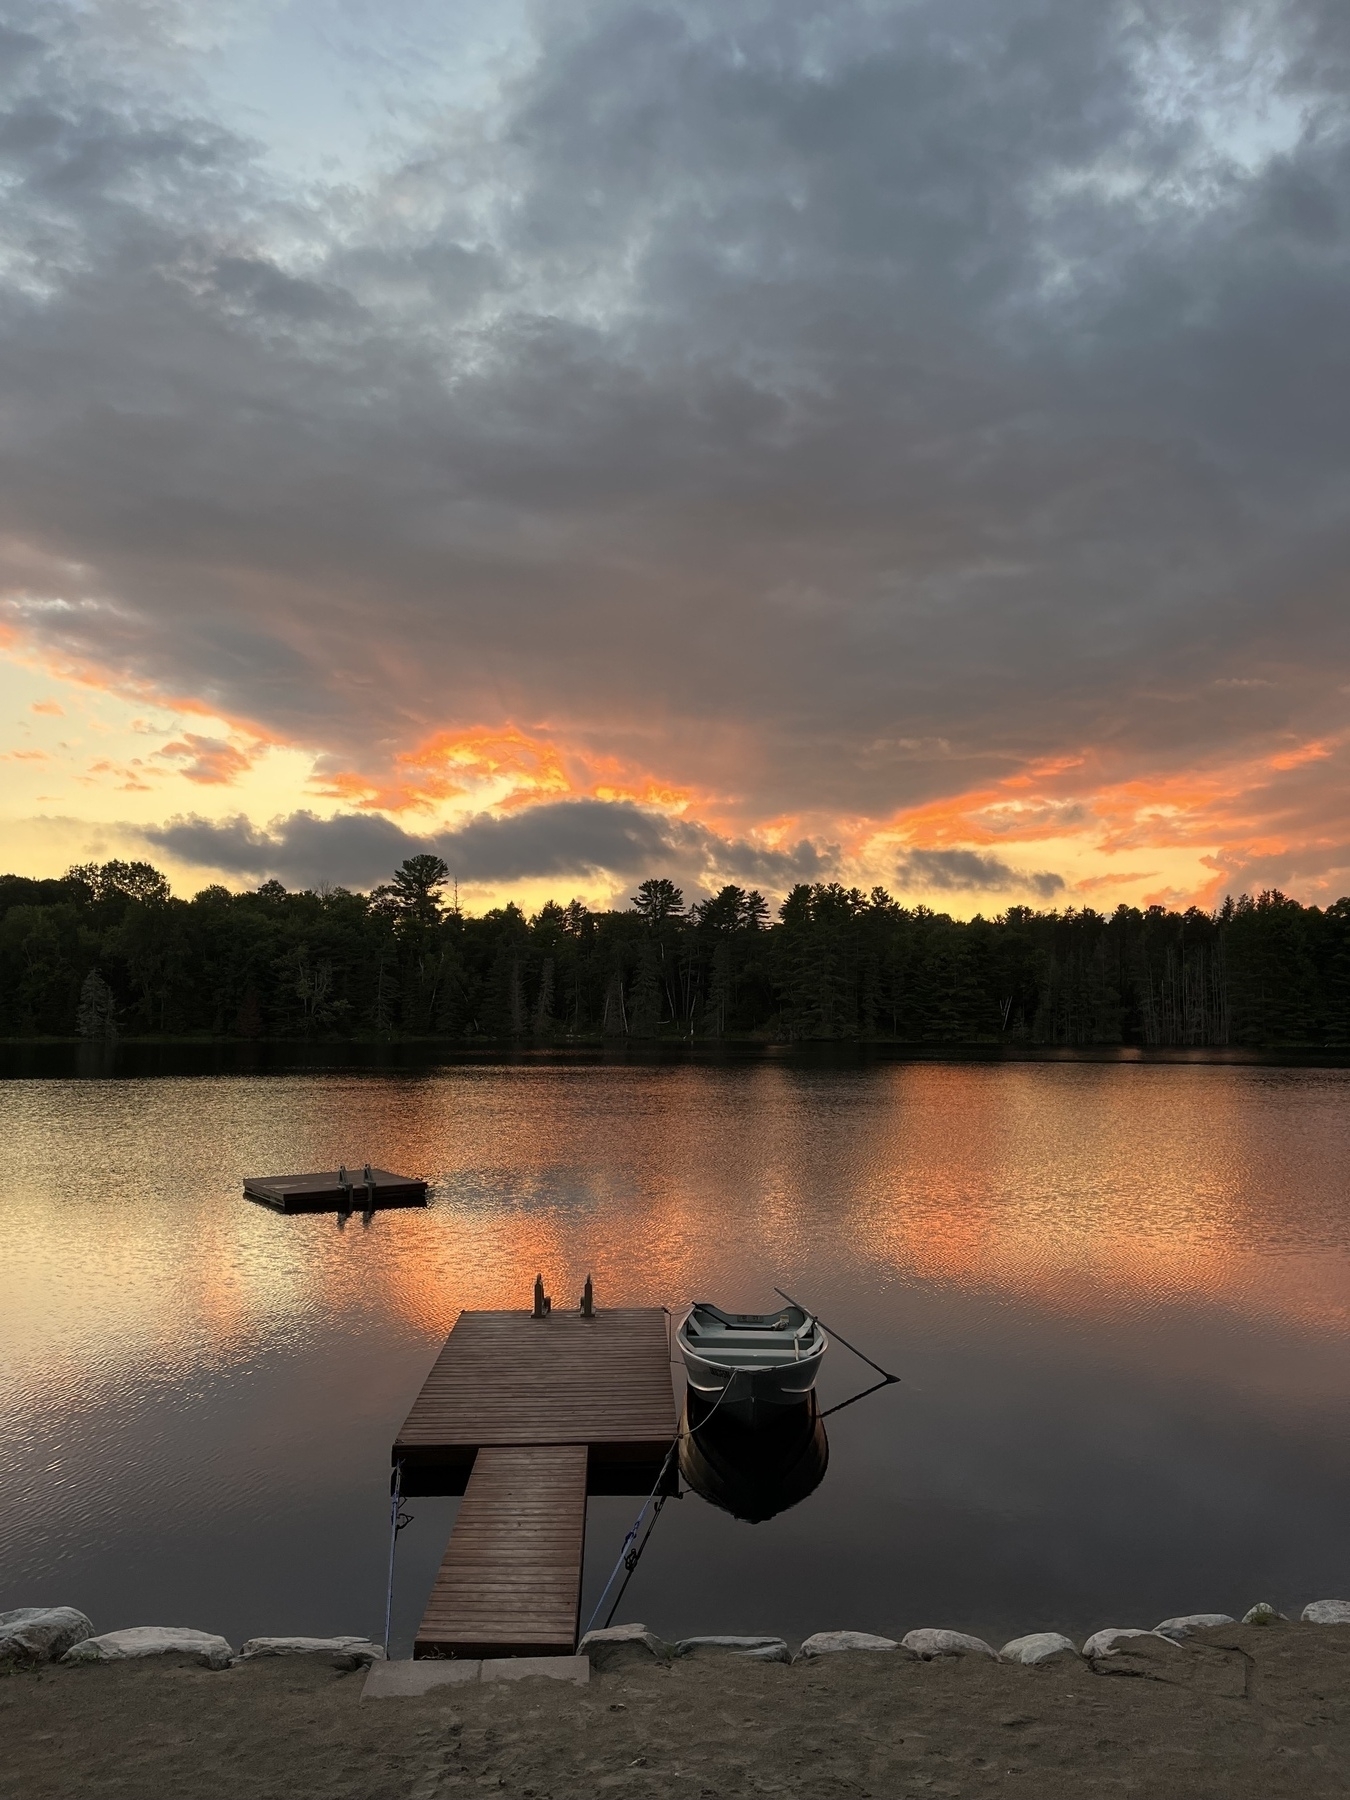
Last night of vacation
I’ve been making an effort to listen to the Moments in Waking Up when the randomly timed notifications come in. This one resonated with me today: “We too have problems that cannot be solved by more thinking”
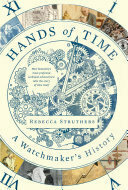
Finished reading: I really enjoyed Hands of Time by Rebecca Struthers. Although notionally about mechanical watches, there’s also interesting ideas about time, building things by hand, and focusing on what really matters.
The book also resurrected an internal debate about the Apple Watch vs mechanical watches. For now, I’m going to take this as inspiration to reconsider my watch faces 📚

Finished reading: Blue Mars by Kim Stanley Robinson finishes the remarkable trilogy. Robinson’s meticulous detail (though occasionally overwhelming) really brings Mars to life, along with compelling characters and ideas. Although I sympathize with the “reds”, I think the series ended appropriately 📚
I’m disappointed that Amazon cancelled The Peripheral. Season 1 was really good 📺
The owner of the cottage we’re renting just switched to StarLink. We’ve gone from 1 Mbps to 10. Nothing like the 1,000 we’re used to at home, though more than enough for lounging around the cottage. The only trouble we had before was that music streaming was unreliable.
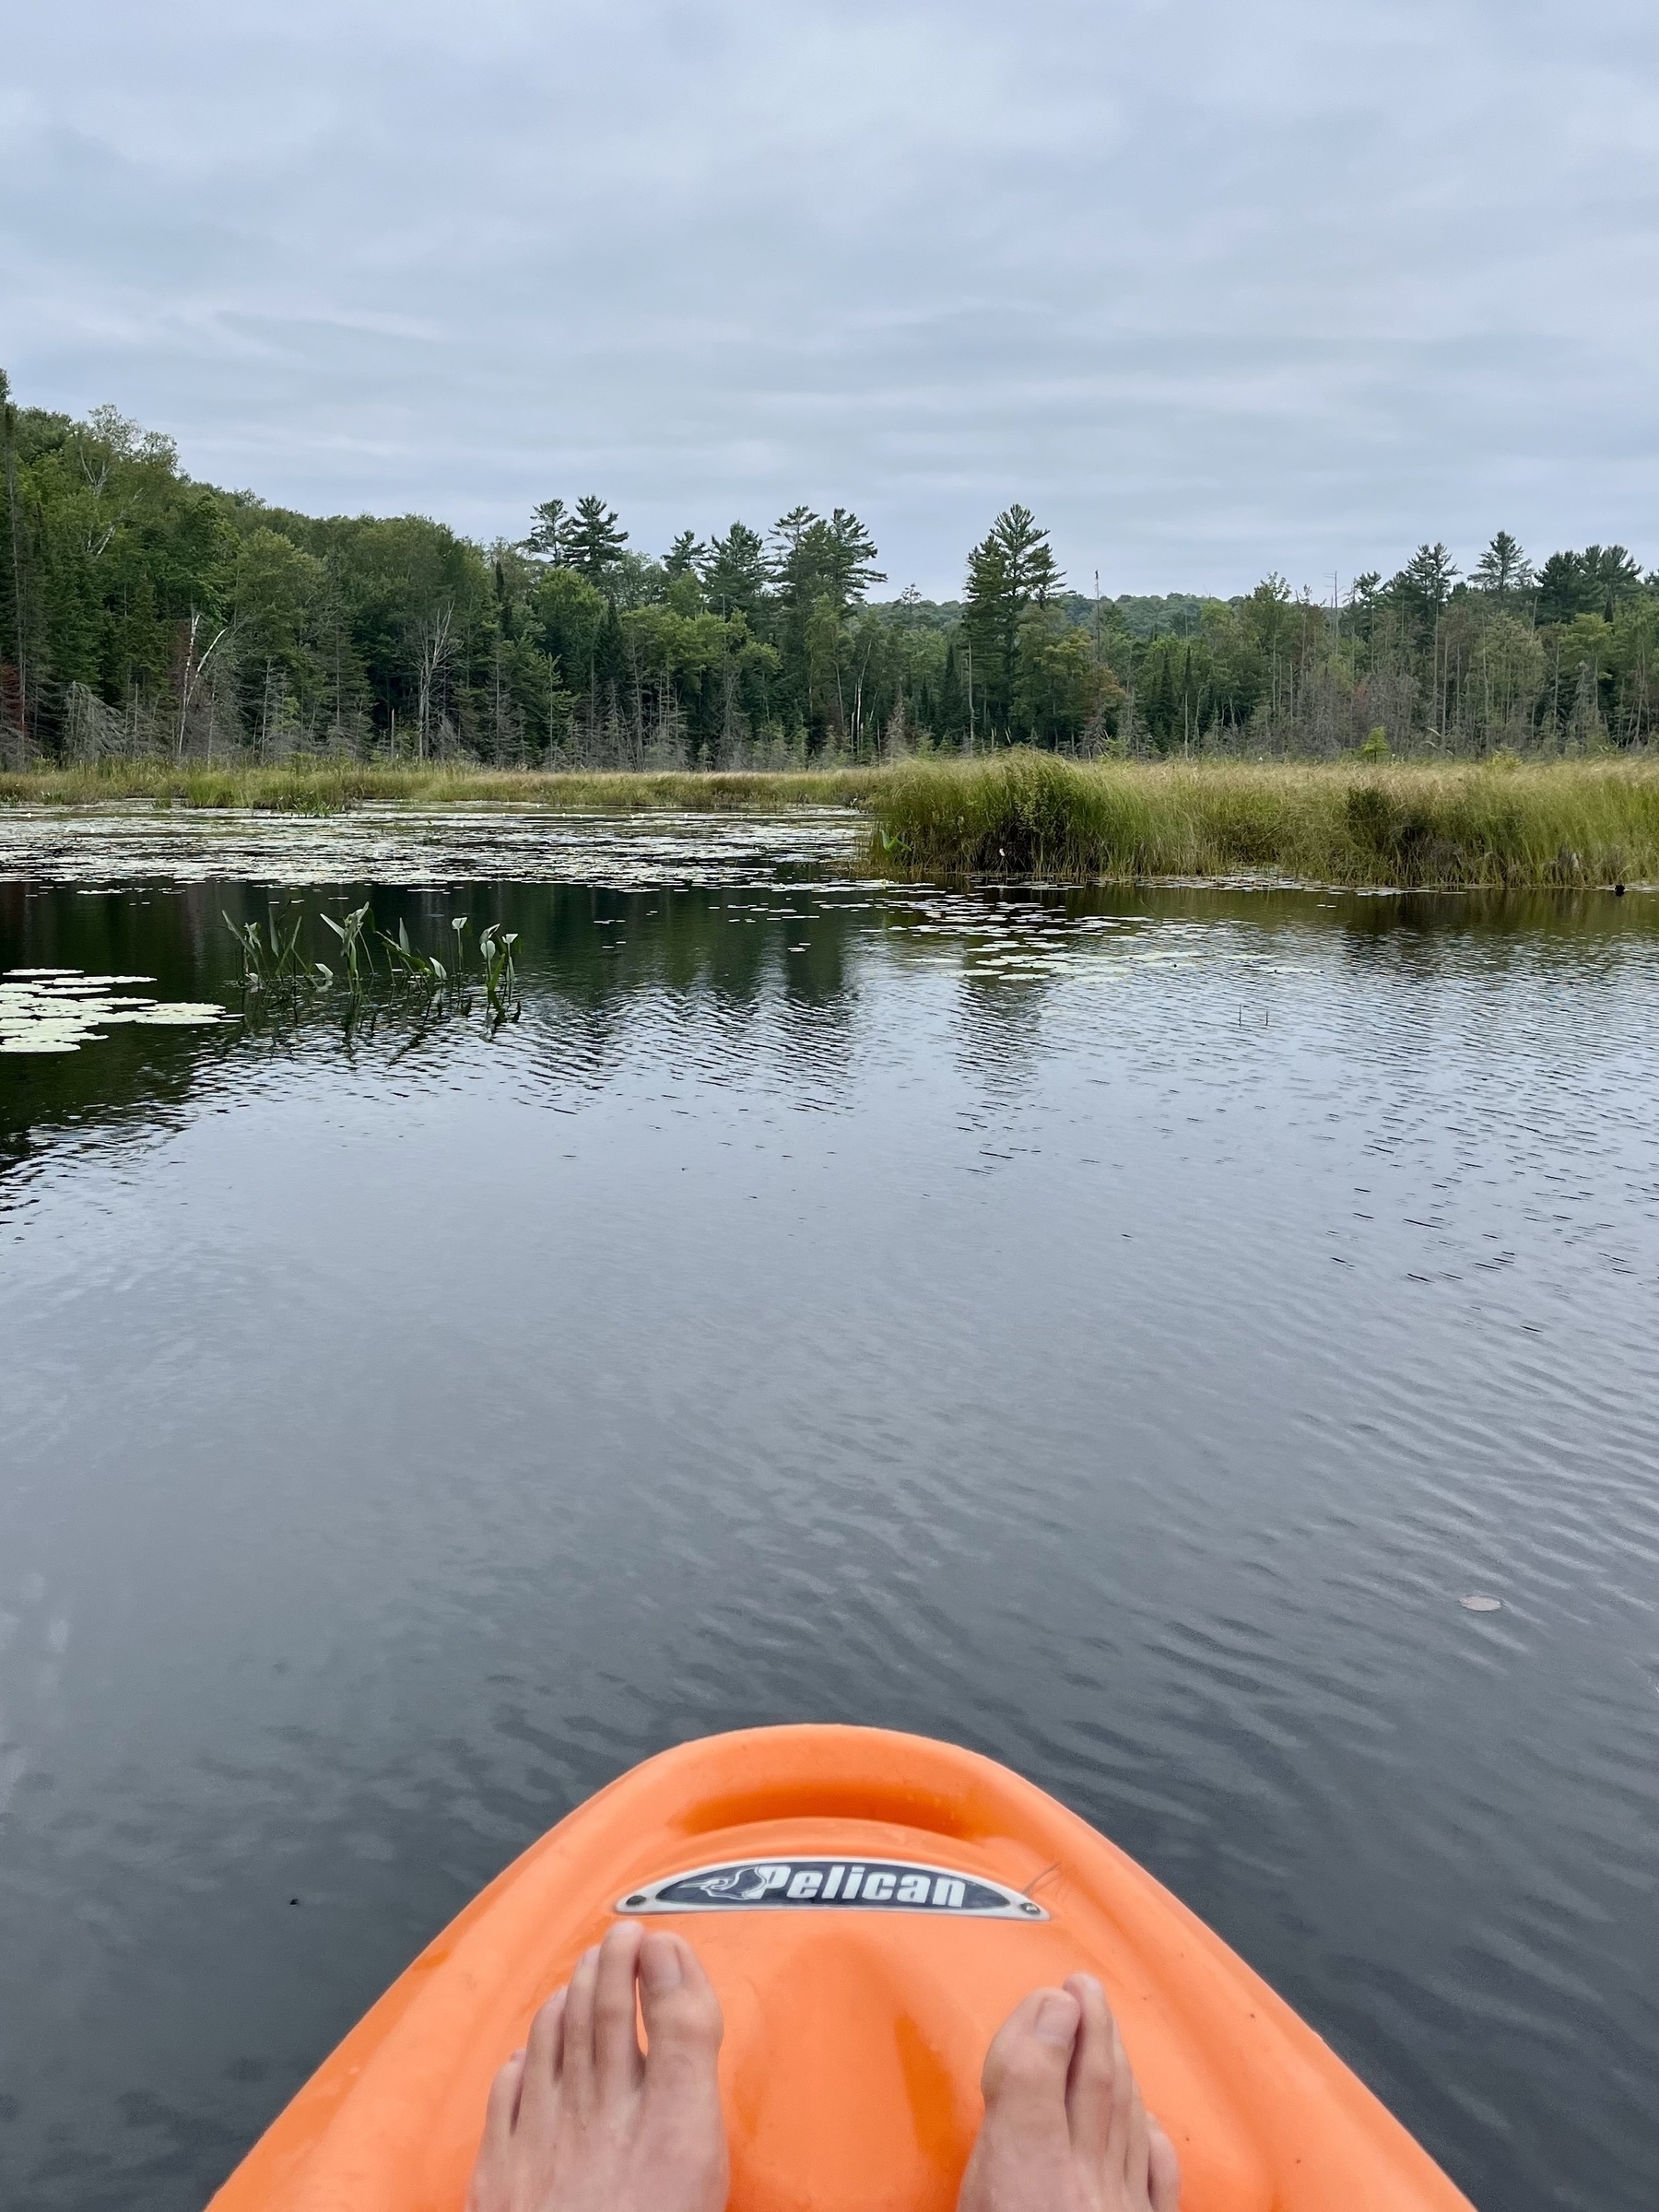
Exploring the lake 🛶
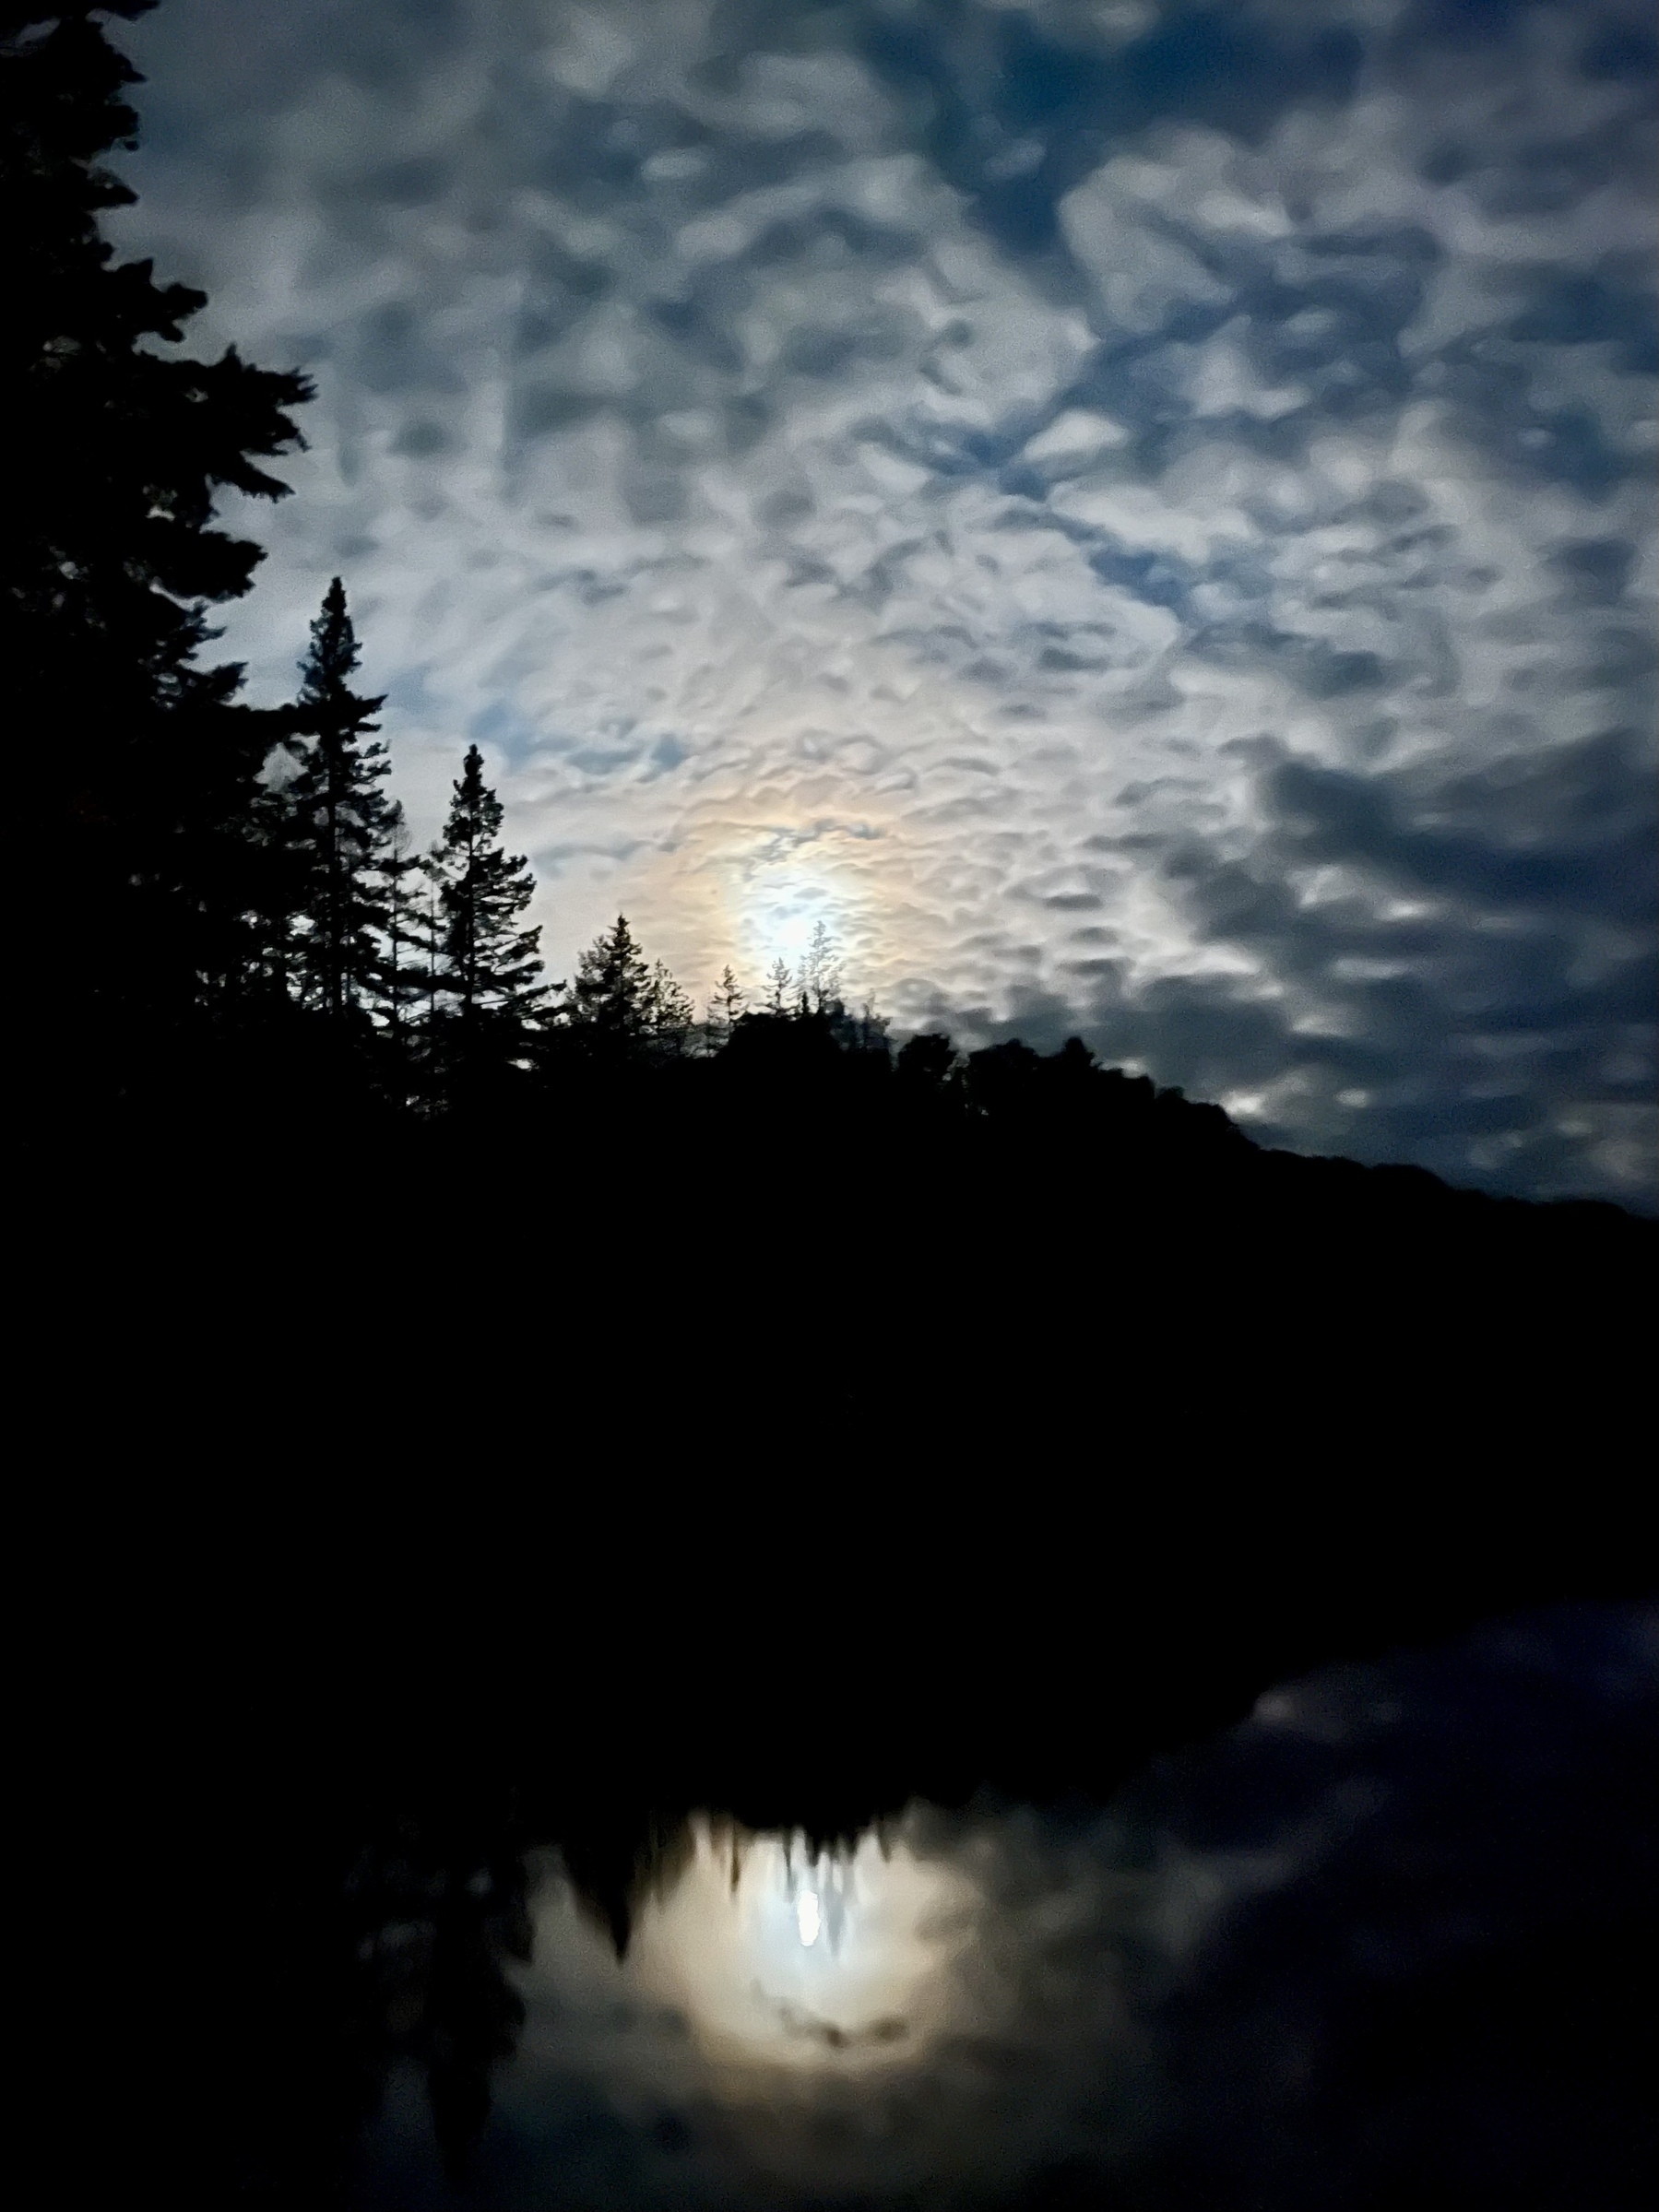
Every night!
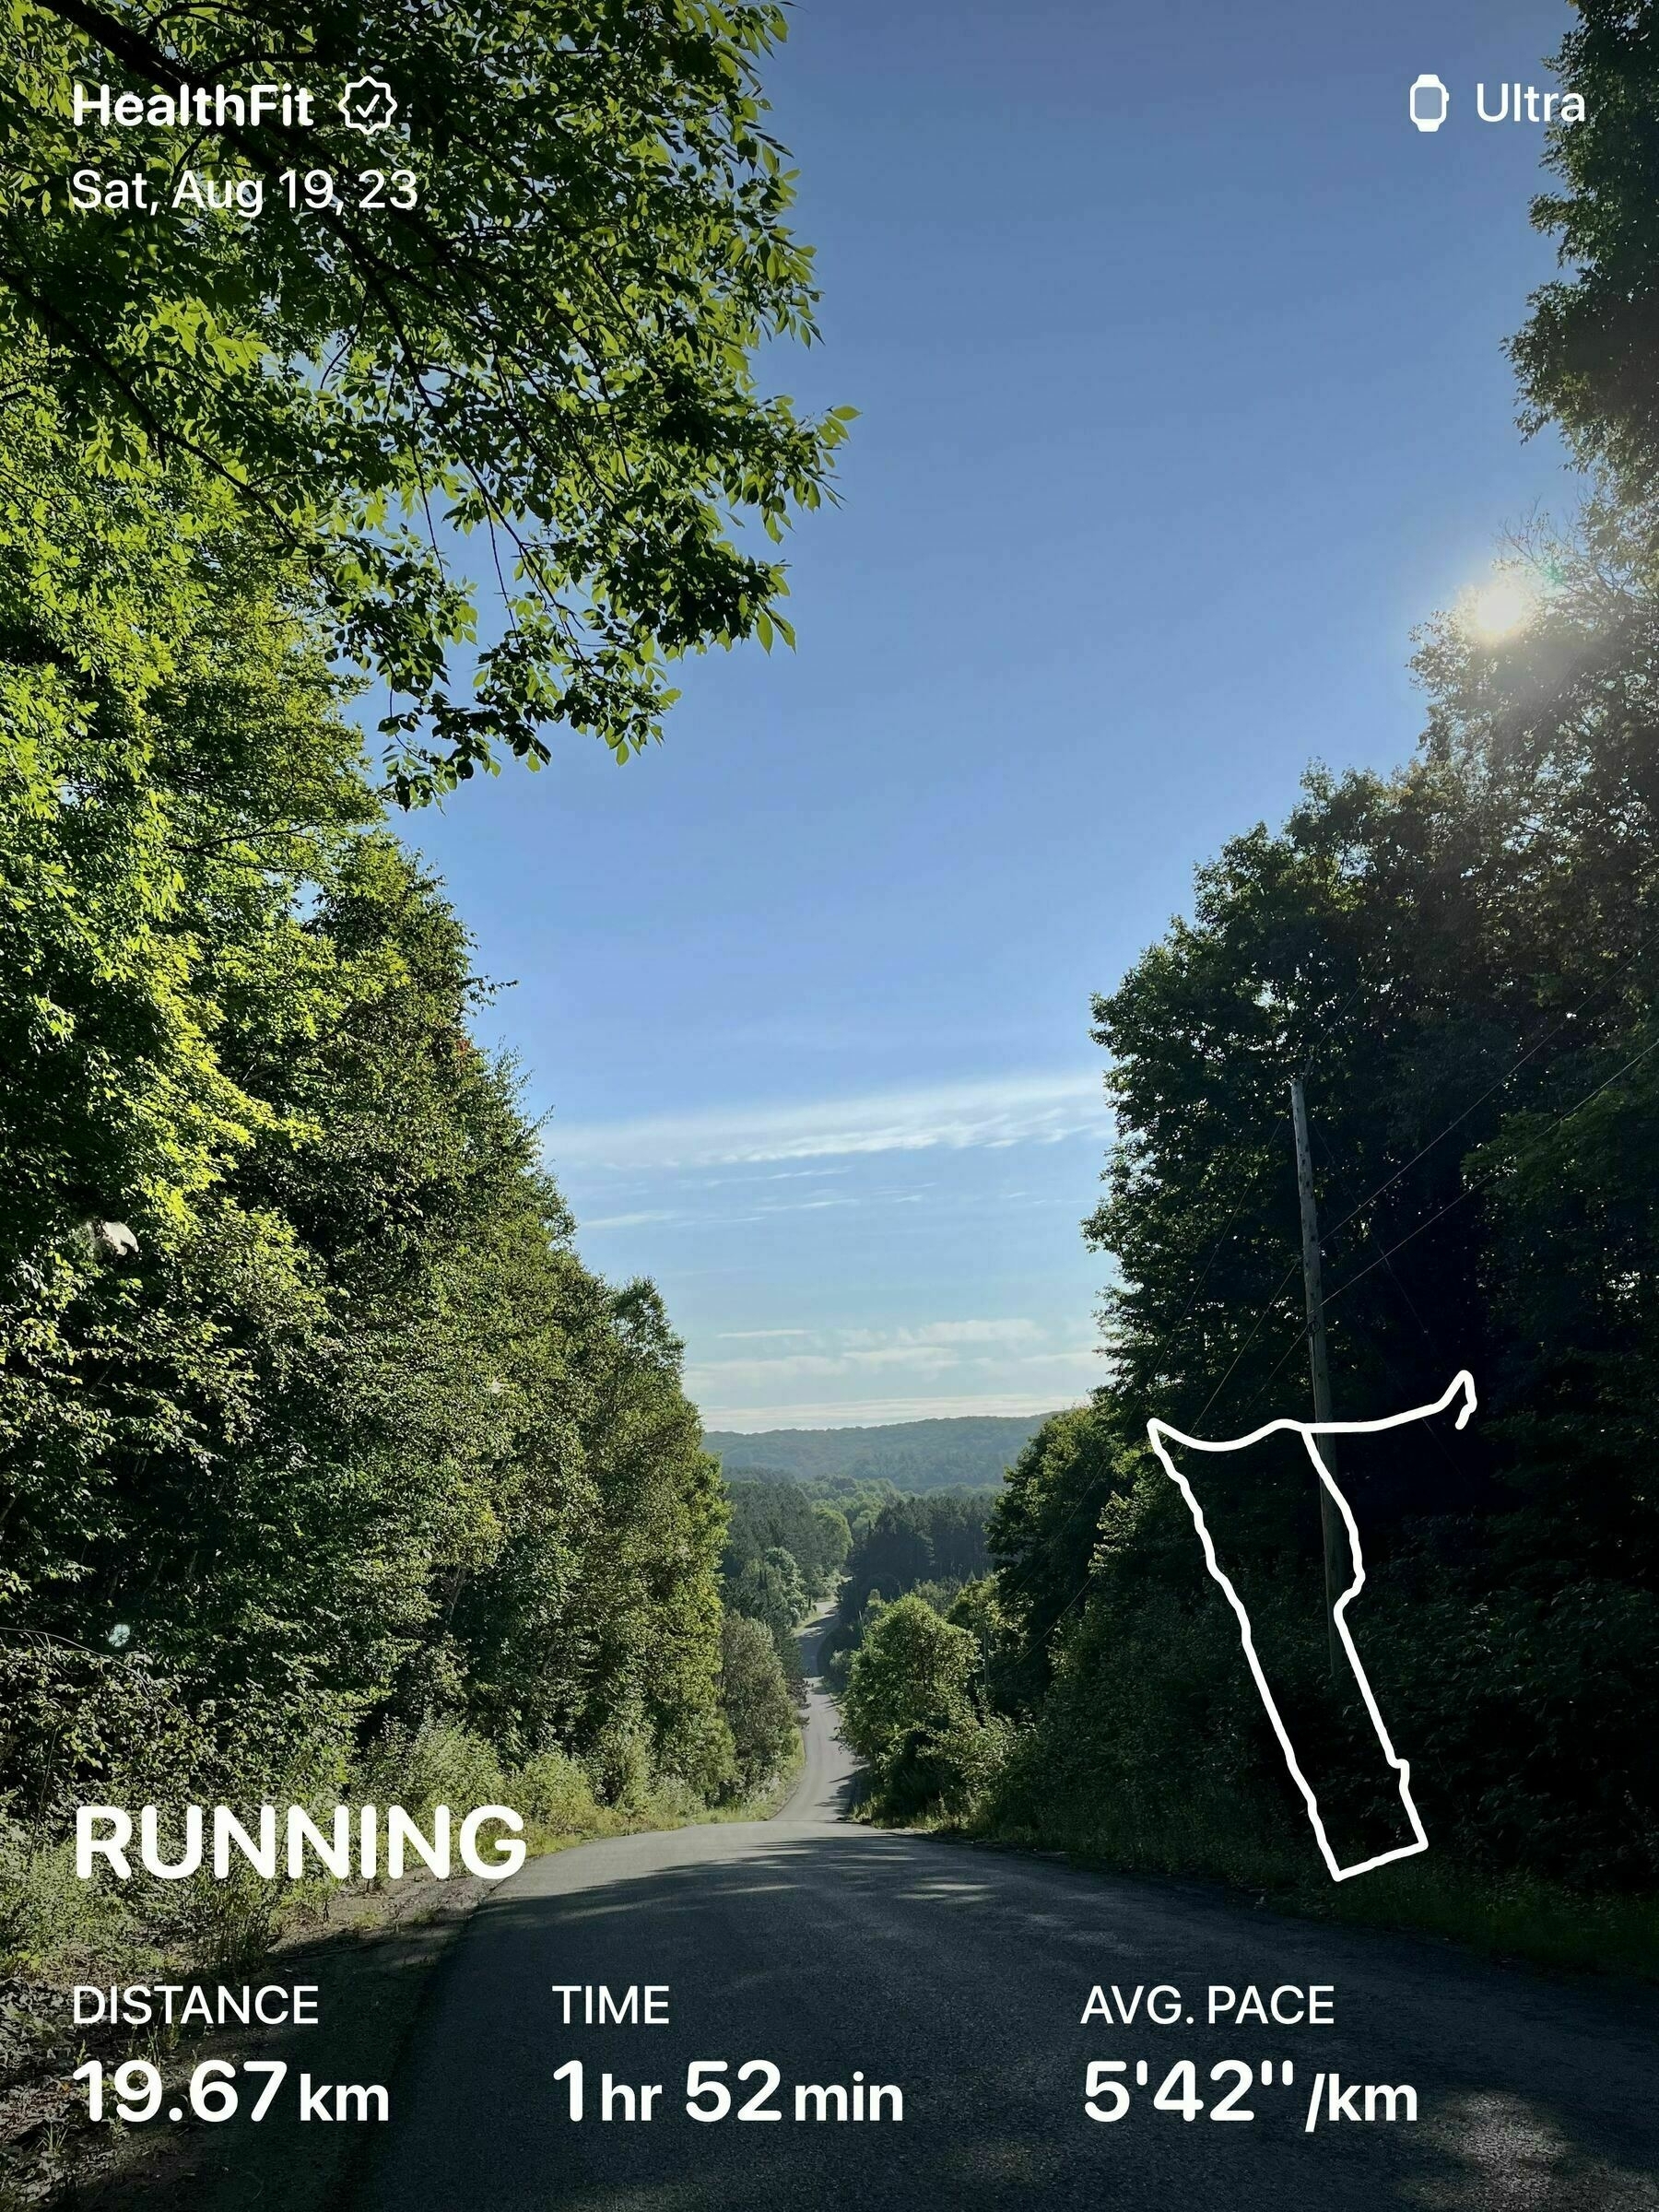
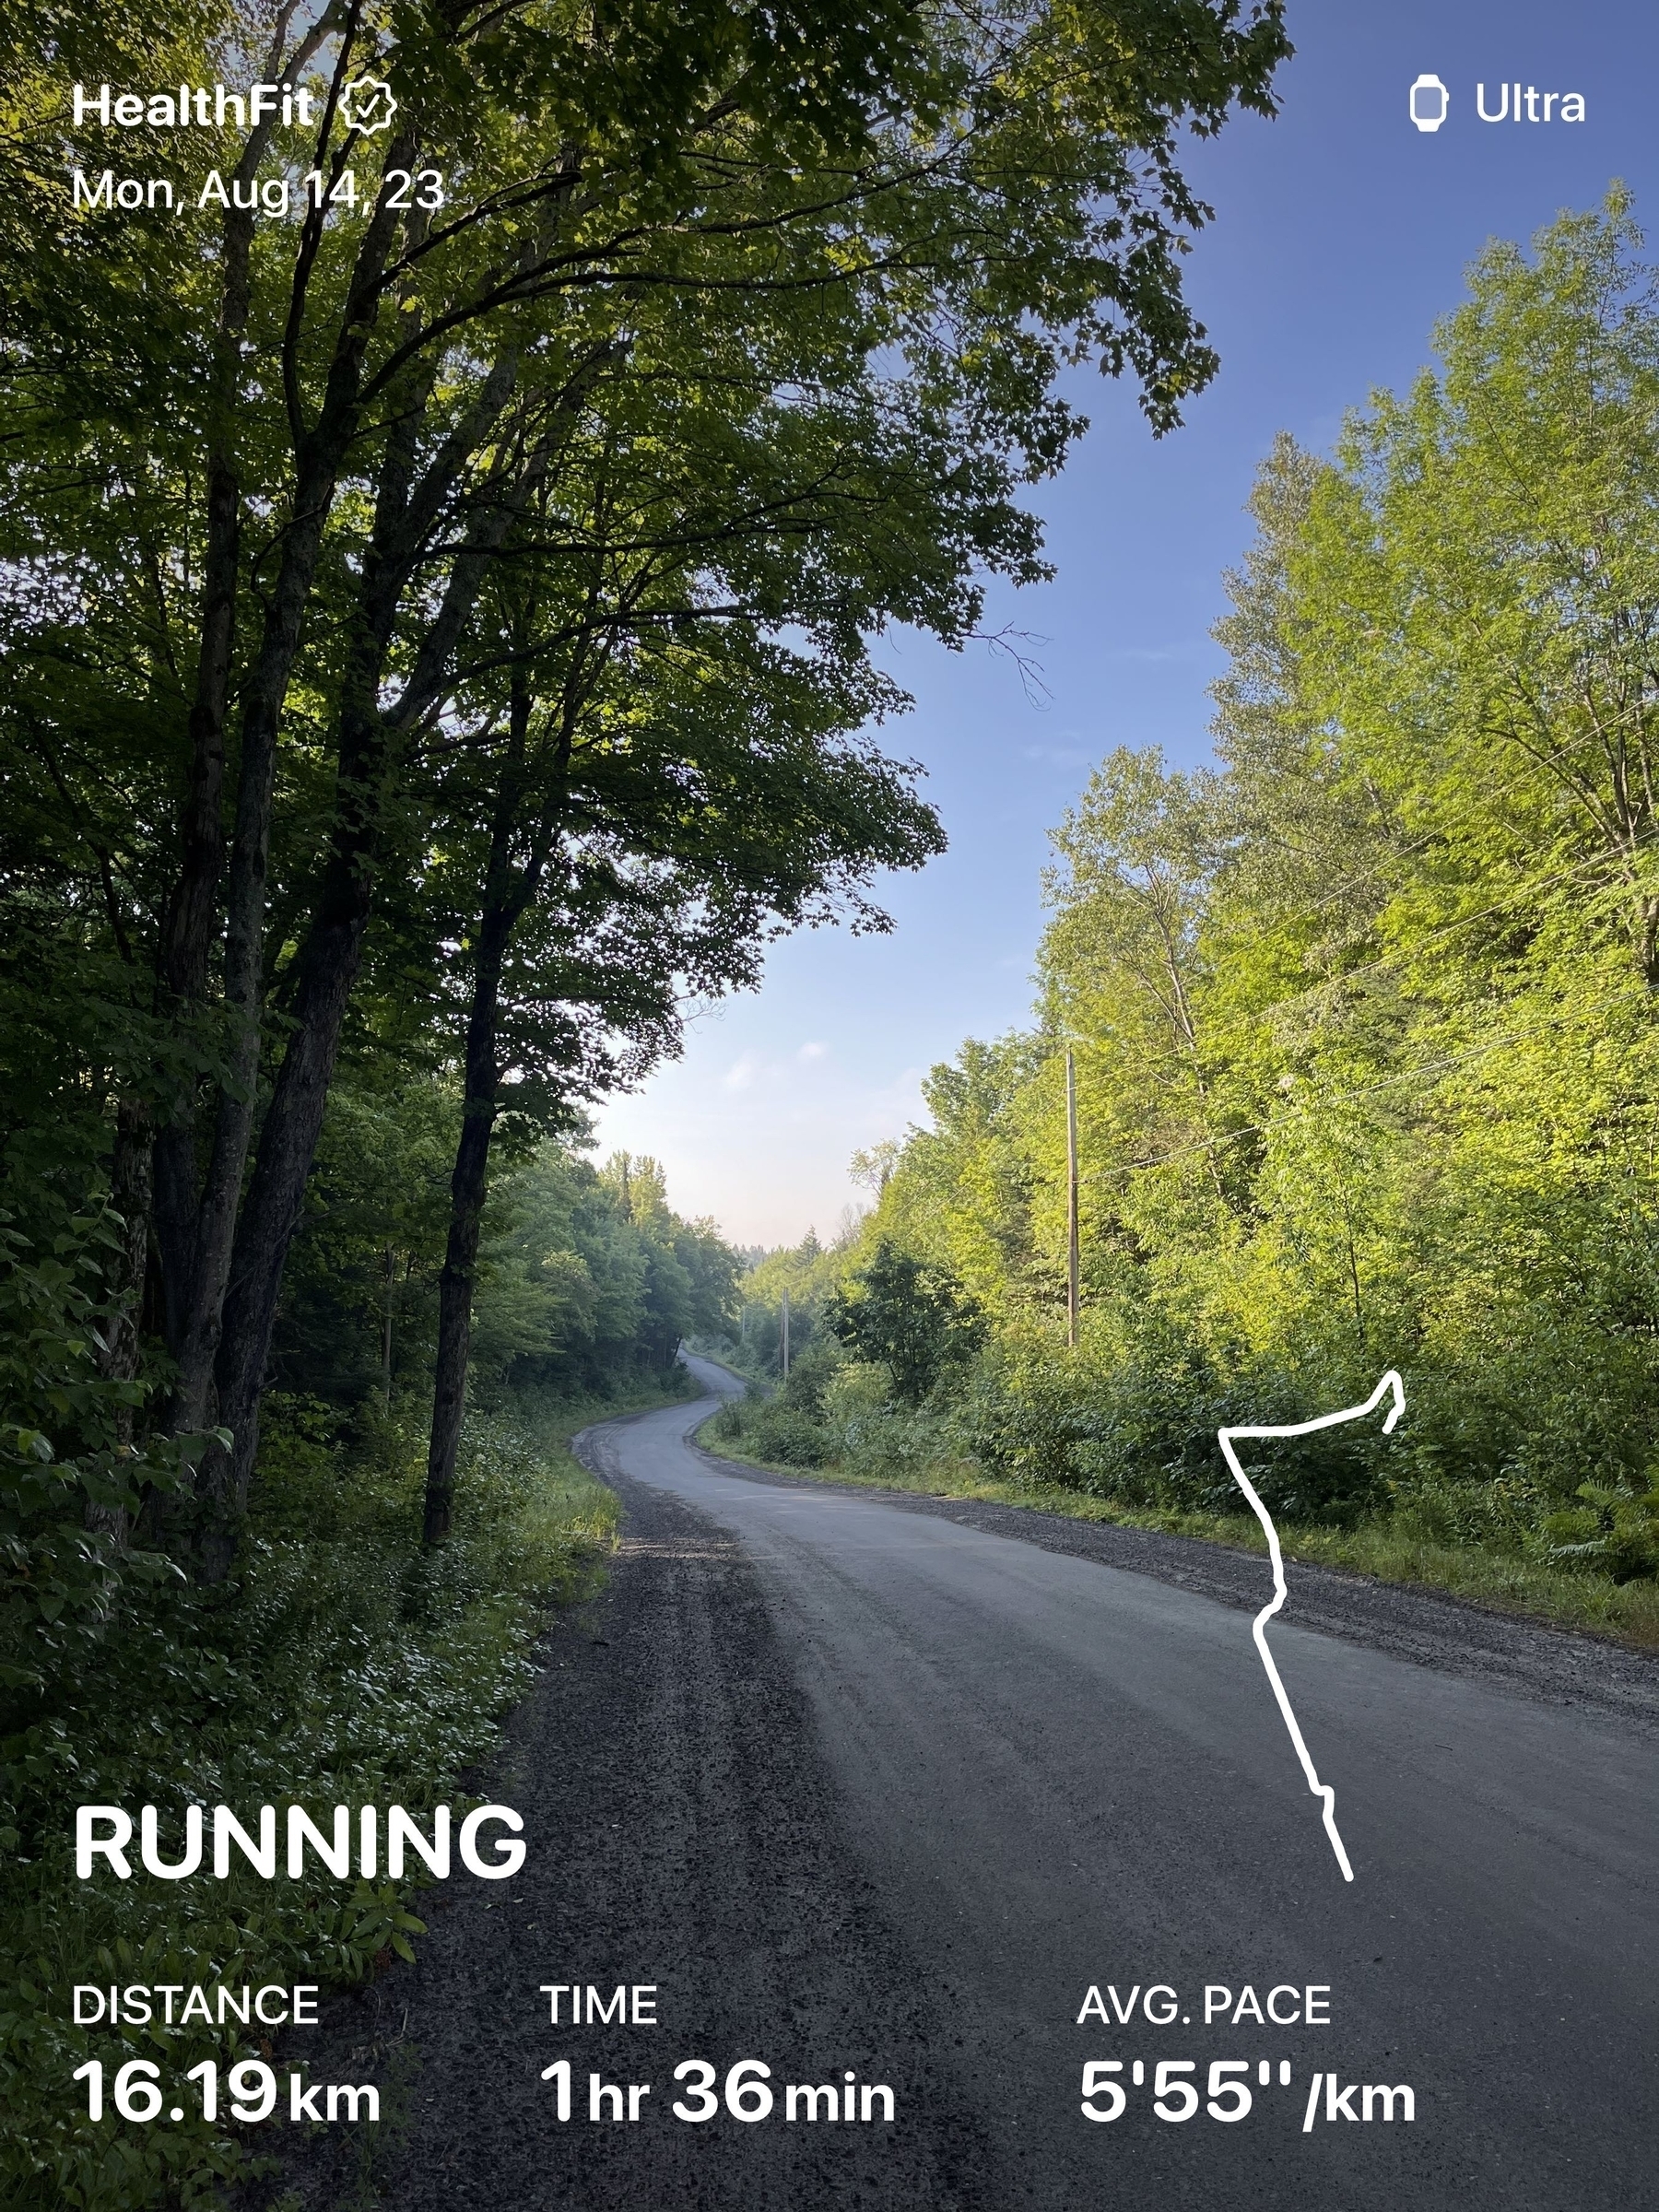
Found another long run loop 🏃♂️
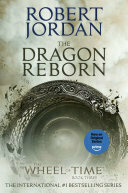
Finished reading: I enjoyed The Dragon Reborn by Robert Jordan. I’m simultaneously pleased and daunted by the number of books left in this series 📚
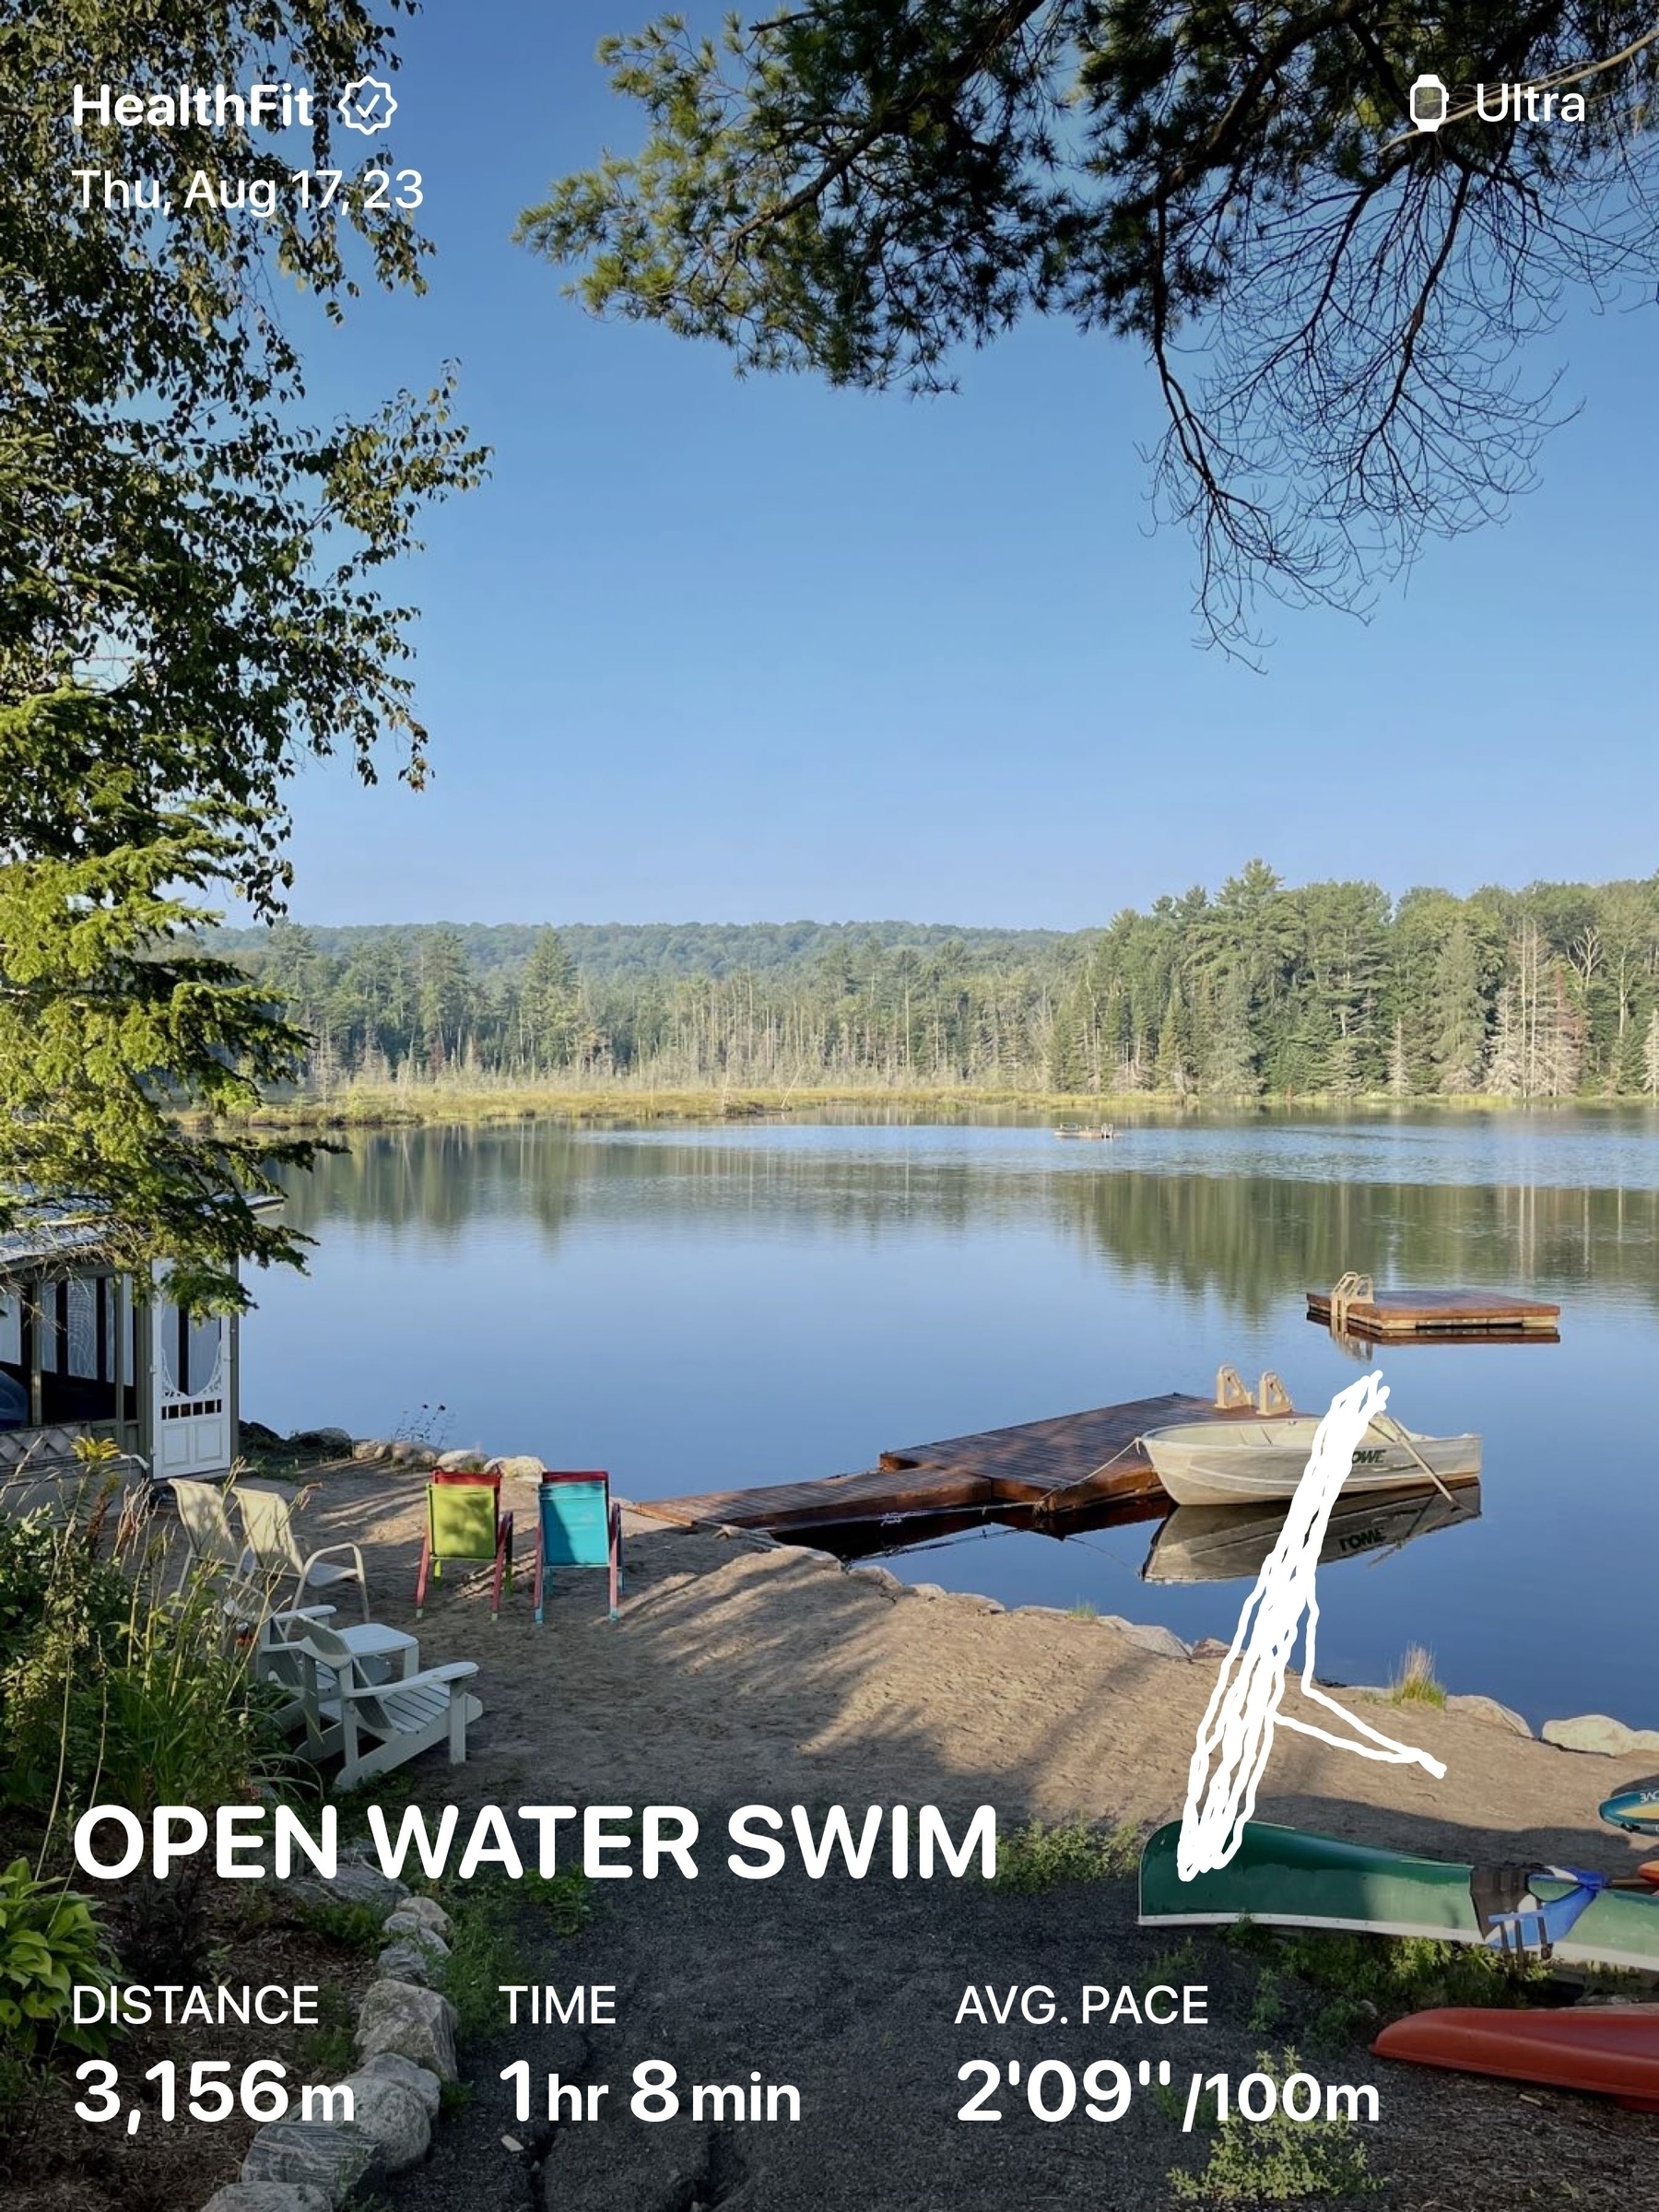
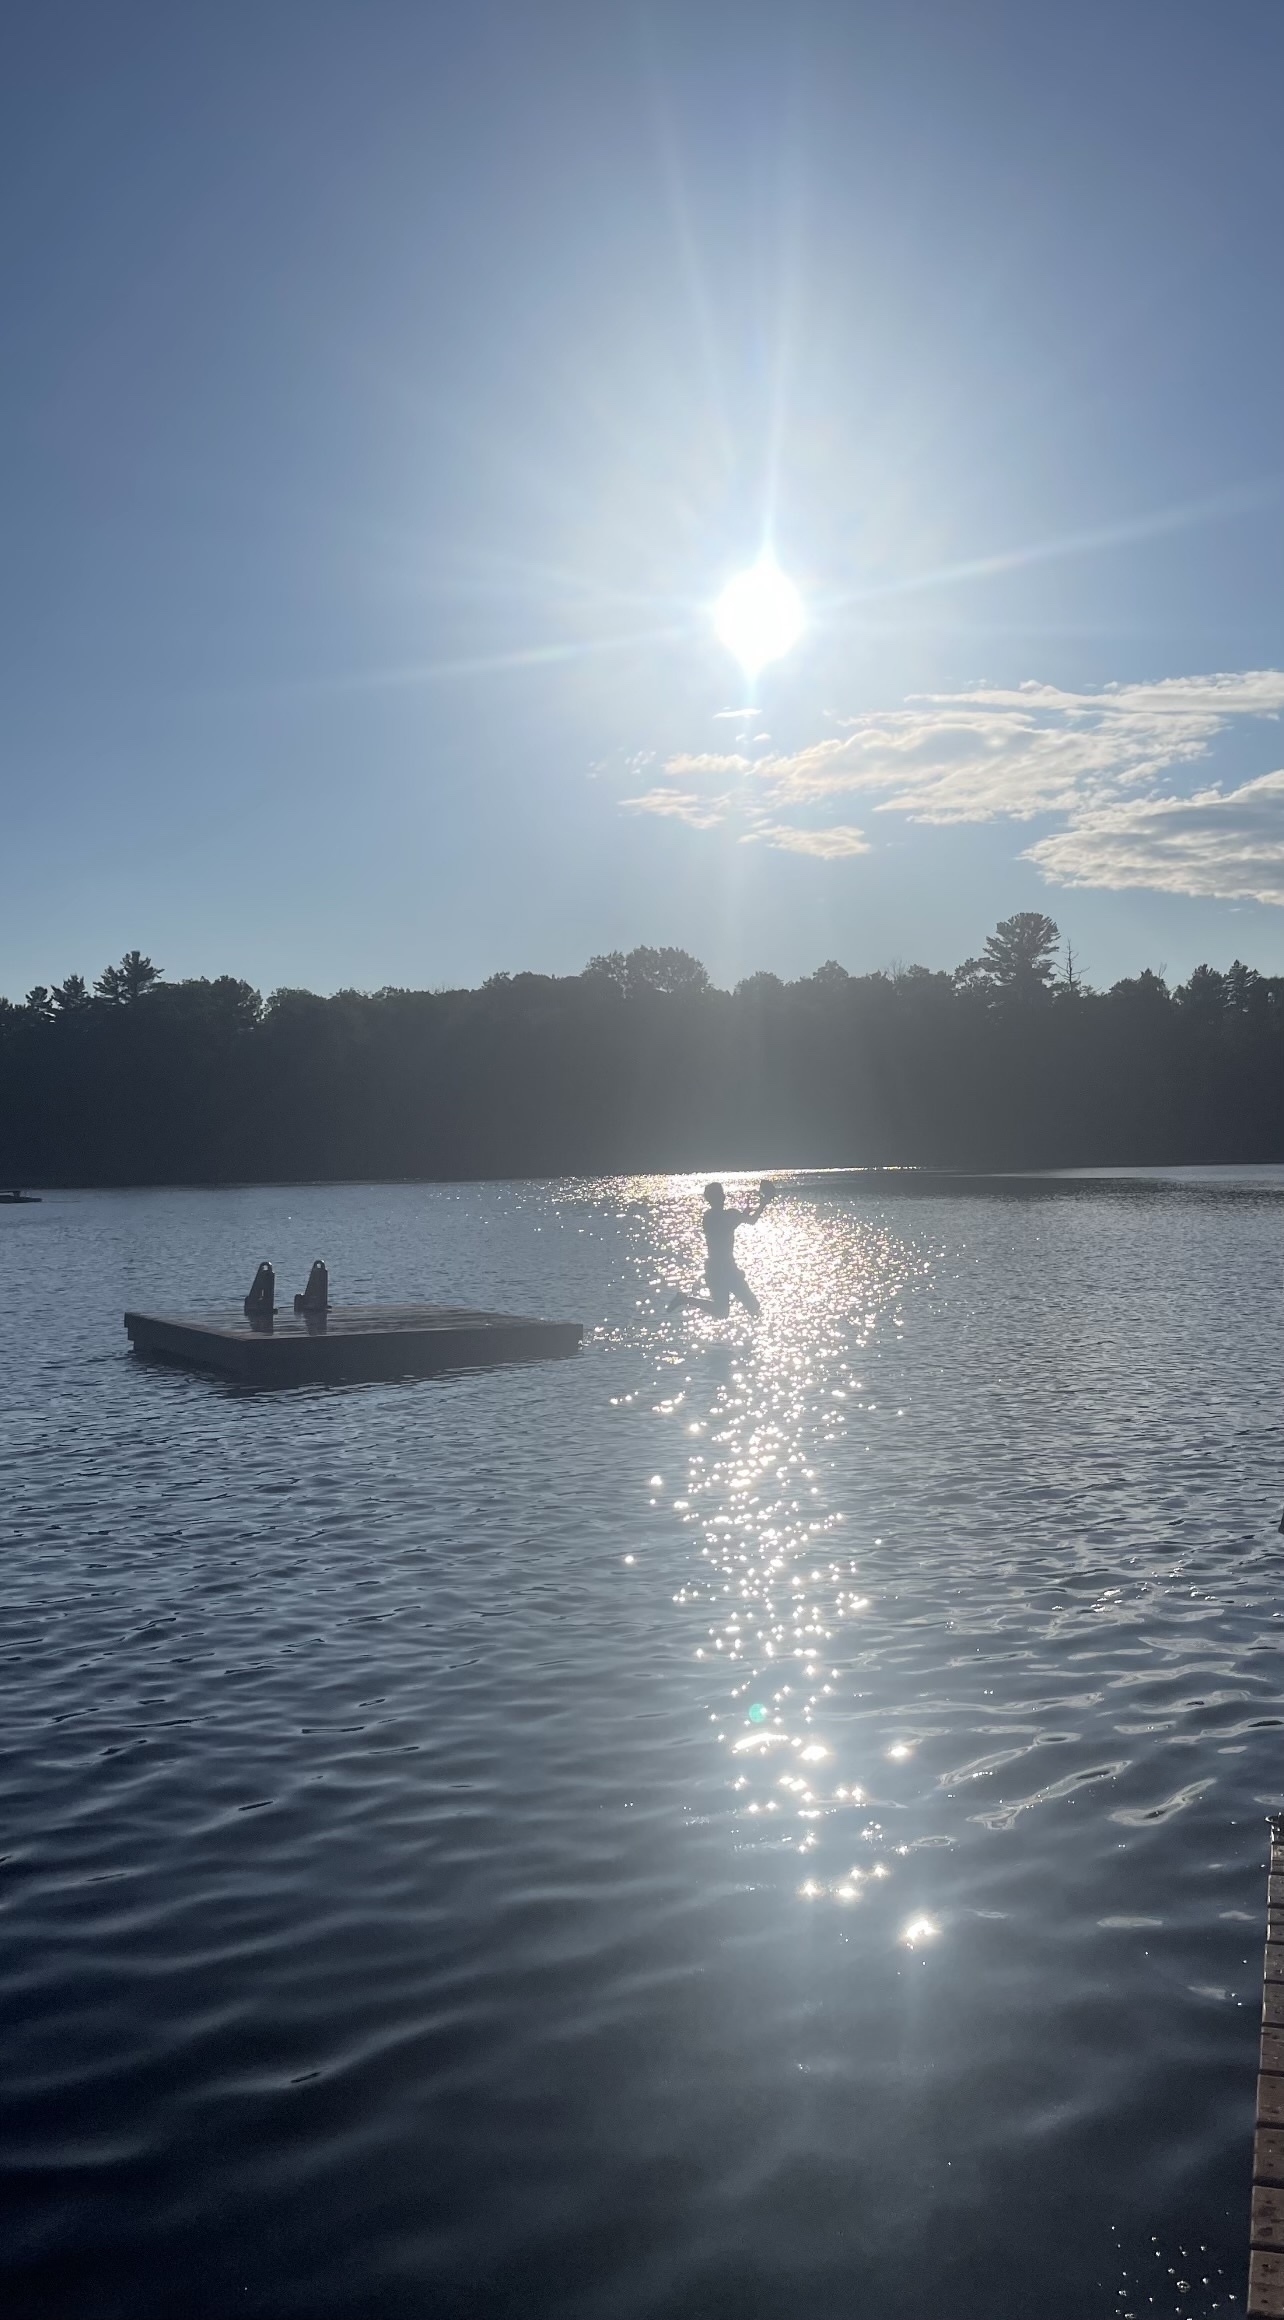
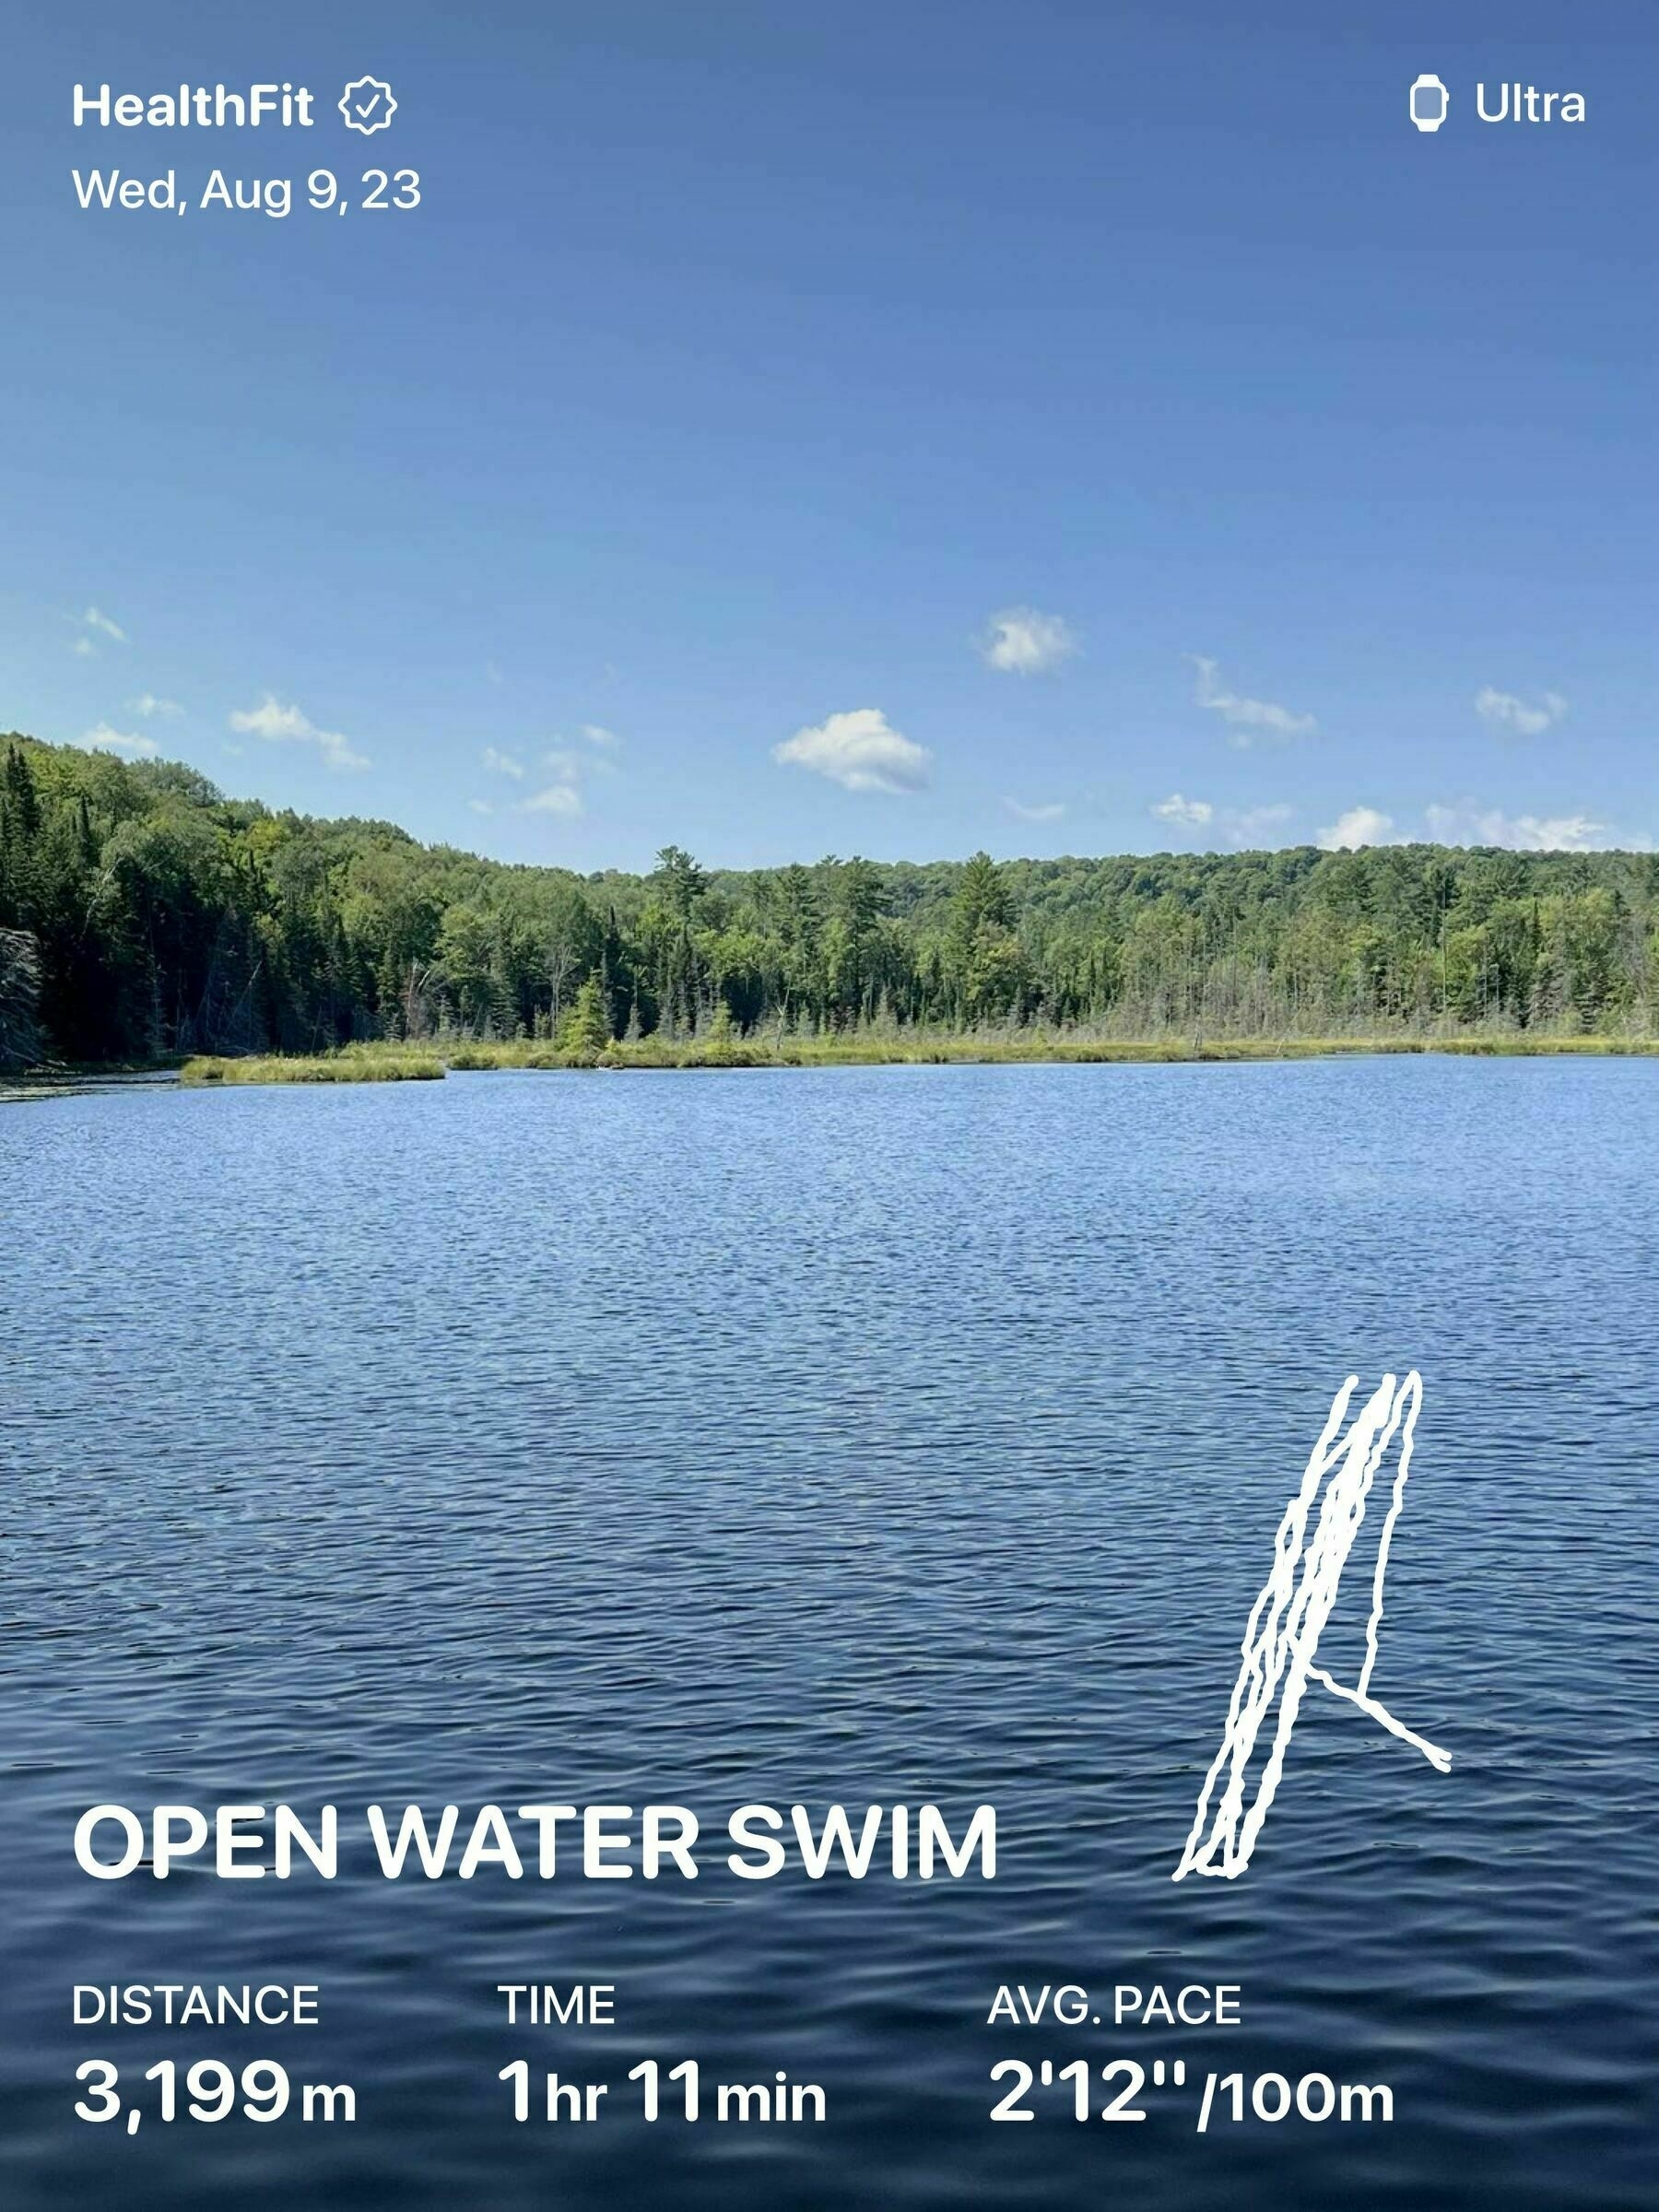
My longest swim yet 🏊♂️
Finished reading: Shards of Earth by Adrian Tchaikovsky is a great start to the series. I enjoy a good story about plucky humans taking on powerful and mysterious aliens with inscrutable motivations 📚
Tried a new route today 🏃♂️

Finished reading: Shaman by Kim Stanley Robinson is a compelling and richly detailed story about a prehistoric tribe. Since I’m on vacation at a cottage in the woods, I felt a stronger connection with the world of the book than I might have at home 📚
Vacation is going well
Kids are having fun on the vacation
Finished reading: I enjoyed the evil, killer Hogwarts of A Deadly Education by Naomi Novik 📚
Highlight of the vacation is having access to a lake and the time for longer swims 🏊♂️
This will do