

Skiing with Grandad


A boy and his dog

Thank you to all the participants, donors, and volunteers for making the third Axe Pancreatic Cancer event such a great success! Together we’re raising awareness and funding to support Pancreatic Cancer Canada.

We’re hosting our third-annual Axe Pancreatic Cancer event. Help us kick off Pancreatic Cancer Awareness Month by drinking beer and throwing axes!


Sticky fingers

Ribs with a fork

Ribfest with @megccase

The day after an historic landslide electoral victory for the Liberal Party of Canada, we’ve compared our predictions (and those of other organizations who provide riding-level predictions) to the actual results in Toronto.
Before getting to the details, we thought it important to highlight that while the methodologies of the other organizations differ, they are all based on tracking sentiments as the campaign unfolds. So, most columns in the table below will differ slightly from the one in our previous post as such sentiments change day to day.
This is fundamentally different from our modelling approach, which utilizes voter and candidate characteristics, and therefore could be applied to predict the results of any campaign before it even begins. (The primary assumption here is that individual voters behave in a consistent way but vote differently from election to election as they are presented with different inputs to their decision-making calculus.) We hope the value of this is obvious.
Now, on to the results! The final predictions of all organizations and the actual results were as follows:
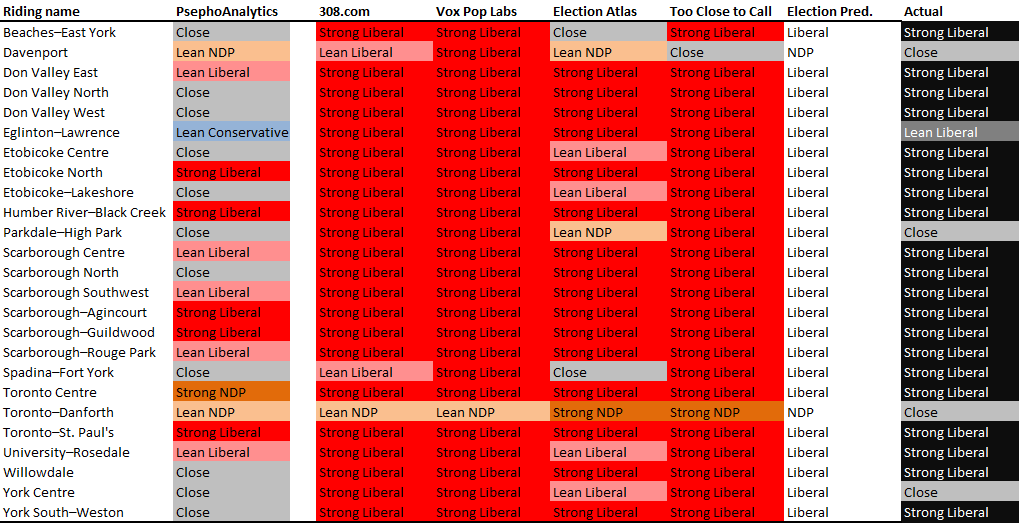
To start with, our predictions included many more close races than the others: while we predicted average margins of victory of about 10 points, the others were predicting averages well above that (ranging from around 25 to 30 points). The actual results fell in between at around 20 points.
Looking at specific races, we did better than the others at predicting close races in York Centre and Parkdale-High Park, where the majority predicted strong Liberal wins. Further, while everyone was wrong in Toronto-Danforth (which went Liberal by only around 1,000 votes), we predicted the smallest margin of victory for the NDP. On top of that, we were as good as the others in six ridings, meaning that we were at least as good as poll tracking in 9 out of 25 ridings (and would have been 79 days ago, before the campaign started, despite the polls changing up until the day before the election).
But that means we did worse in the others ridings, particularly Toronto Centre (where our model was way off), and a handful of races that the model said would be close but ended up being strong Liberal wins. While we need to undertake much more detailed analysis (once Elections Canada releases such details), the “surprise” in many of these cases was the extent to which voters, who might normally vote NDP, chose to vote Liberal this time around (likely a coalescence of “anti-Harper” sentiment).
Overall, we are pleased with how the model stood up, and know that we have more work to do to improve our accuracy. This will include more data and more variables that influence voters’ decisions. Thankfully, we now have a few years before the next election…
Well, it is now only days until the 42nd Canadian election, and we have come a long way since this long campaign started. Based on our analyses to date of voter and candidate characteristics, we can now provide riding-level predictions. As we keep saying, we have avoided the use of polls, so these present more of an experiment than anything else. Nonetheless, we’ve put them beside the predictions of five other organizations (as of the afternoon of 15 October 2015), specifically:
(We’ll note that the last doesn’t provide the likelihood of a win, so isn’t colour-coded below, but does provide additional information for our purposes here.)
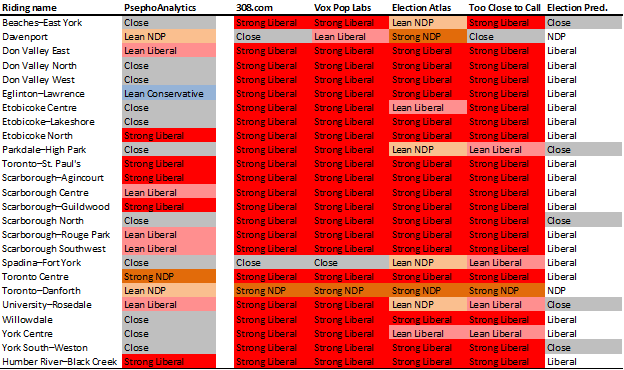
You’ll see that we’re predicting more close races than all the others combined, and more “leaning” races. In fact, the average margin of victory from 308, Vox Pop, and Too Close to Call are 23%/26%/23% respectively, which sounds high. Nonetheless, the two truly notable differences we’re predicting are in Eglinton-Lawrence, where the consensus is that finance minister Joe Oliver will lose badly (we predict he might win) and Toronto Centre, where Bill Munro is predicted to easily beat Linda McQuaig (we predict the opposite).
Anyway, we’re excited to see how these predictions look come Monday, and we’ll come back after the election with an analysis of our performance.
Now, get out and vote!
We’ve started looking into what might be a natural cycle between governing parties, which may account for some of our differences to the polls that we’ve seen. The terminology often heard is “time for a change” – and this sentiment, while very difficult to include in voter characteristics, is possible to model as a high level risk to governing parties.
To start, we reran our predictions with an incumbent-year interaction, to see if the incumbency bonus changed over time. Turns out it does – incumbency effect declines over time. But it is difficult to determine, from only a few years of data, whether we’re simply seeing a reversion to the mean. So we need more data – and likely at a higher level.
Let’s start with the proportion of votes received by each of today’s three major parties (or their predecessors – whose names we’ll simply substitute with modern party names), with trend lines, in every federal election since Confederation:
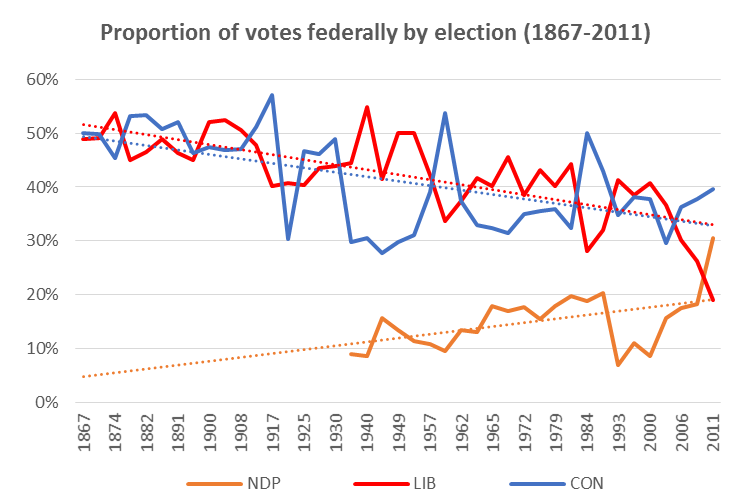
This chart shows that the Liberal & Conservative trend lines are essentially the same, and that the two parties effectively cycle as the governing party over this line.
Prior to a noticeable 3rd party (i.e., the NDP starting in the 1962 election and its predecessor Co-operative Commonwealth Federation starting in the 1935 election) the Liberals and Conservatives effectively flipped back and forth in terms of governing (6 times over 68 years), averaging around 48% of the vote each. Since then, the flip has continued (10 more times over the following 80 years), and the median proportion of votes for Liberals, Conservatives, and NDP has been 41%/35%/16% respectively.
Further, since 1962, the Liberals have been very slowly losing support (about 0.25 points per election), while the other two parties have been very slowly gaining it (about 0.05 points per election), though there has been considerable variation across each election, making this slightly harder to use in predictions. (We’ll look into including this in our risk modeling).
Next, we looked at some stats about governing:
All of these stats would suggest that Harper is due for a loss: he has been the sole PM for his party for 9.7 years, which is over twice his party’s average length for a PM-ship. He’s also second all-time behind Macdonald in a consecutive Conservative PM role (having past Mulroney and Borden last year). From a risk-model perspective, Harper is likely about to become hit hard by the “time for a change” narrative.
But how much will this actually affect Conservative results? And how much will their opponents benefit? These are critical questions to our predictions.
In any election where the governing party lost (averaging once every 9 years; though 7 years for Conservatives, and 11 years for Liberals), that party saw a median drop of 6.1 points from the preceding election (average of 8.1 points). Since 1962 (first election with the NDP), that loss has been 5.5 points. But do any of those votes go to the NDP? Turns out, not really: those 5.5 points appear to (at least on average) switch back to the new governing party.
Given the risk to the current governing party, we would forecast a 5.5%-6.1% shift from the Conservatives to the Liberals, on top of all our other estimates (which would not overlap with any of this analysis), assuming that Toronto would feel the same about change as the rest of the country has historically.
That would mean our comparisons to recent Toronto-specific polls would look like this:
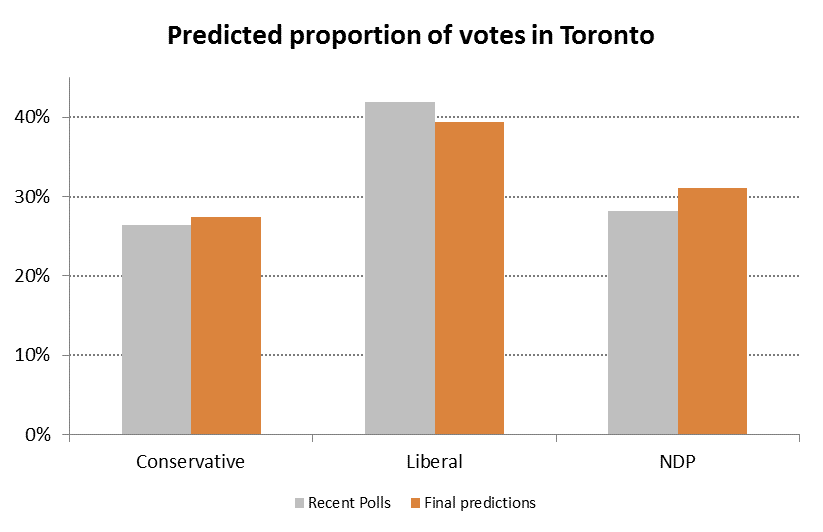
Remember – our analysis has avoided the use of polls, so these results (assuming the polls are right) are quite impressive.
Next up (and last before the election on Monday) will be our riding-level predictions.
Political psychologists have long held that over-simplified “rational” models of voters do not help accurately predict their actual behavior. What most behavioural researchers have found is the decision-making (e.g., voting) often boils down to emotional, unconscious factors. So, in attempting to build up our voting agents, we will need to at least:
Given that we are unable to peek into voters’ minds (and remember: we are trying to avoid using polls[1]), we need data for (or proxies for) factors that might influence someone’s vote. So, we gathered (or created) and joined detailed data for the 2006, 2008, and 2011 Canadian federal elections (as well as the 2015 election, which will be used for predictions).
In a new paper, we discuss what influence multiple factors, such as “leader likeability”, incumbency, “star” status, demographics and policy platforms, may have on voting outcomes, and use these results to predict the upcoming federal election in Toronto ridings.
At a high-level, we find that:
With our empirical results, we can turn to predicting the 2015 federal election in Toronto ridings. It turns out that our Toronto-wide results are fairly in line with recent Toronto-specific polling results (weighted by age and sample size) – though we’ll see how right we all are come election day – which means that there may some inherent truth in the coefficients we have found.
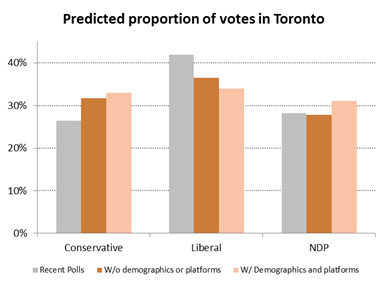
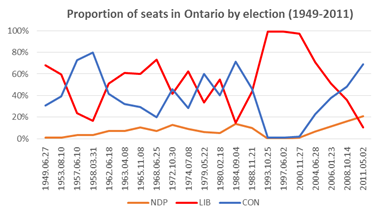
Given that we haven’t used polls or included localized details or party platforms, these results are surprisingly good. The seeming shift from Liberal to Conservative is something that we’ll need to look into further. It is likely highlighting an issue with our data: namely, that we only have three years of detailed federal elections data, and these elections have seen some of the best showings for the Conservatives (and their predecessors) in Ontario since the end of the second world war (the exceptions being in the late 1950s with Diefenbaker, 1979 with Joe Clark, and 1984 with Brian Mulroney), with some of the worst for the Liberals over the same time frame. That is, we are not picking up a (cyclical) reversion to the mean in our variables, but might investigate the cycle itself.
Nonetheless, given we set out to understand (both theoretically and empirically) how to predict an election while significantly limiting the use of polls, and it appears that we are at least on the right track.
[1] This is true for a number of reasons: first, we want to be able to simulate elections, and therefore would not always have access to polls; second, we are trying to do something fundamentally different by observing behaviour instead of asking people questions, which often leads to lying (e.g., social desirability biases: see the “Bradley effect”); third, while polls in aggregate are generally good at predicting outcomes, individual polls are highly volatile.
Given that we are unable to peek into voters’ minds (remember: we are trying to avoid using polls as much as possible), we need data (or proxies) for factors that might influence someone’s vote. We gathered (or created) and joined data for the 2006, 2008, and 2011 Canadian federal elections (as well as the 2015 election, which will be used for predictions) for Toronto ridings.
We’ll be explaining all this in more detail next week, but for now, here are some basics:
Regressing these data against the proportion of votes received across ridings yields some interesting results. First: party, leader likeability, star candidate, and incumbency are all statistically significant (as is the interaction of star candidate and incumbency). This isn’t a surprise, given the literature around what it is that drives voters’ decisions. (Note that we haven’t yet included demographics or party platforms.)
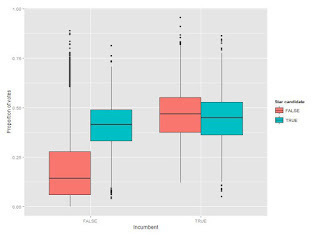
Breaking down the results: Being a star candidate or an incumbent (but not both) adds about 20 points right off the top, so name recognition obviously matters a lot. Likeability matter too; a leader that essentially polls the same as their party yields candidates about 14 points. (As an example of what this means, Stephane Dion lost the average Liberal candidate in Toronto about 9 points relative to Paul Martin. Alternatively, in 2011, Jack Layton added about 16 points more to NDP candidates in Toronto than Michael Ignatieff did for equivalent Liberal candidates.) Finally, party base matters too: for example, being an average Liberal candidate in Toronto adds about 17 points over the equivalent NDP candidate. (We expect some of this will be explained with demographics and party platforms.)
To be clear, these are average results, so we can’t yet use them effectively for predicting individual riding-level races (that will come later). But, if we apply them to all 2015 races in Toronto and aggregate across the city, we would predict voting proportions very similar to the results of a recent poll by Mainstreet (if undecided voters split proportionally):
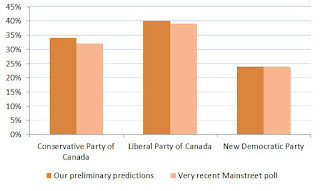
Given that we haven’t used polls or included localized details or party platforms, these results are amazing, and give us a lot of confidence that we’re making fantastic progress in understanding voter behaviour (at least in Toronto).
Analyzing the upcoming federal election requires collecting and integrating new data. This is often the most challenging part of any analysis and we’ve committed significant efforts to obtaining good data for federal elections in Toronto’s electoral districts.
Clearly, the first place to start was with Elections Canada and the results of previous general elections. These are available for download as collections of Excel files, which aren’t the most convenient format. So, our toVotes package has been updated to include results from the 2006, 2008, and 2011 federal elections for electoral districts in Toronto. The toFederalVotes data frame provides the candidate’s name, party, whether they were an incumbent, and the number of votes they received by electoral district and poll number. Across the three elections, this amounts to 82,314 observations.
Connecting these voting data with other characteristics requires knowing where each electoral district and poll are in Toronto. So, we created spatial joins among datasets to integrate them (e.g., combining demographics from census data with the vote results). Shapefiles for each of the three federal elections are available for download, but the location identifiers aren’t a clean match between the Excel and shapefiles. Thanks to some help from Elections Canada, we were able to translate the location identifiers and join the voting data to the election shapefiles. This gives us close to 4,000 poll locations across 23 electoral districts in each year. We then used the census shapefiles to aggregate these voting data into 579 census tracts. These tracts are relatively stable and give us a common geographical classification for all of our data.
This work is currently in the experimental fed-geo branch of the toVotes package and will be pulled into the main branch soon. Now, with votes aggregated into census tracts, we can use the census data for Toronto in our toCensus package to explore how demographics affect voting outcomes.
Getting the data to this point was more work than we expected, but well worth the effort. We’re excited to see what we can learn from these data and look forward to sharing the results with you.
A number of people have been asking whether we are going to analyze the upcoming federal election on October 19, like we did for the Toronto mayoral race last year. The truth is, we never stopped working after the mayoral race, but are back with a vengeance for the next five weeks.
We have gathered tonnes of new data and refined our methodology. We have also established a new domain name: psephoanalytics.ca. You can still subscribe to email updates here, or follow us on twitter @psephoanalytics. Finally, if you’d like to chat directly, please email us psephoanalytics@gmail.com.
Nonetheless, stay tuned for lots of updates over the coming weeks, culminating in some predictions for Toronto ridings prior to October 19.
The first (and long) step in moving towards agent-based modeling is the creation of the agents themselves. While fictional, they must represent reality – meaning they need to behave like actual people. The main issue in voter modeling, however, is that since voting is private we do not know how individuals behave, only collections of voters – and we do not want them all to behave the exact same way. That is why one of the key elements of our work is the ability to create meaningful differences among our agents – particularly when it comes to the likes of issue positions and political engagement.
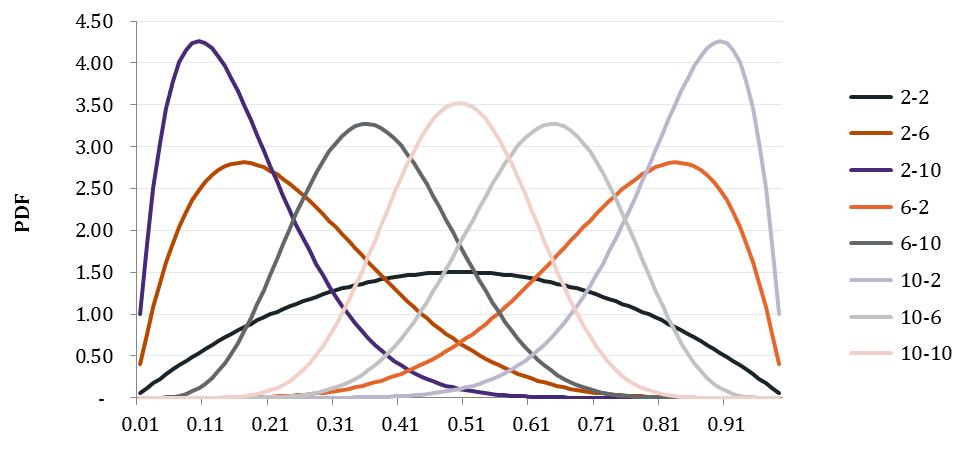
The obvious difficulty is how to do that. In our model, many of our agents’ characteristics are limited to values between 0 and 1 (e.g., political positions, weights on given issues). Many standard distributions, such as the normal, would be cut off at these extremes, creating unrealistic “spikes” of extreme behaviour. We also cannot use uniform distributions, as the likelihood of individuals in a group looking somewhat the same (i.e., more around an average) seems much more reasonable than them looking uniformly different.
Which brings us to the β distribution. In a new paper, we discuss applying this family of distributions to voter characteristics. While there is great diversity in the potential shapes of these distributions - granting us the flexibility we need - in (likely) very extreme cases, the shape will not “look like” what we would expect. Therefore, one of our goals will be to somewhat constrain our selection of fixed values for α and β, based on as much empirical data as possible, to ensure we get this balance right.
A selection α-β combinations that generate “useful” distributions:
As the next Federal General Election gets closer, we’re turning our analytical attention to how the election might play out in Toronto. The first step, of course, is to gather data on prior elections. So, we’ve updated our toVotes data package to include the results of the 2008 and 2011 federal elections for electoral districts in Toronto.
This dataset includes the votes received by each candidate in each district and poll in Toronto. We also include the party affiliation of the candidate and whether they are an incumbent. These data are currently stored in a separate dataset from the mayoral results, since the geography of the electoral districts and wards aren’t directly comparable. We’ll work on integrating these datasets more closely and adding in further election results over the coming weeks.
Hopefully the general availability of cleaned and integrated datasets, such as this one, will help generate more analytically-based discussions of the upcoming election.