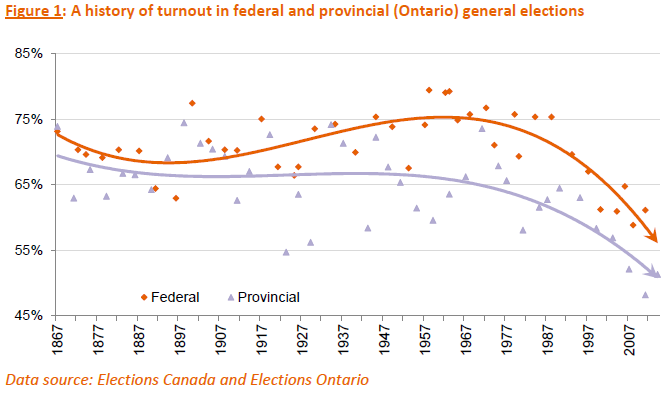
Turnout is often seen as (at least an easy) metric of the health of a democracy – as voting is a primary activity in civic engagement. However, turnout rates continue to decline across many jurisdictions[i]. This is certainly true in Canada and Ontario.
From the PsephoAnalytics perspective – namely, accurately predicting the results of elections (particularly when using an agent-based model (ABM) approach) – requires understanding what it is that drives the decision to vote at all, instead of simply staying home.
If this can be done, we would not only improve our estimates in an empirical (or at least heuristic) way, but might also be able to make normative statements about elections. That is, we hope to be able to suggest ways in which turnout could be improved, and whether (or how much) that mattered.
In a new paper we start to investigate the history of turnout in Canada and Ontario, and review what the literature says about the factors associated with turnout, in an effort to help “teach” our agents when and why they “want” to vote. More work will certainly be required here, but this provides a very good start.
We value constructive feedback and continuous improvement, so we’ve taken a careful look at how our predictions held up for the recent mayoral election in Toronto.
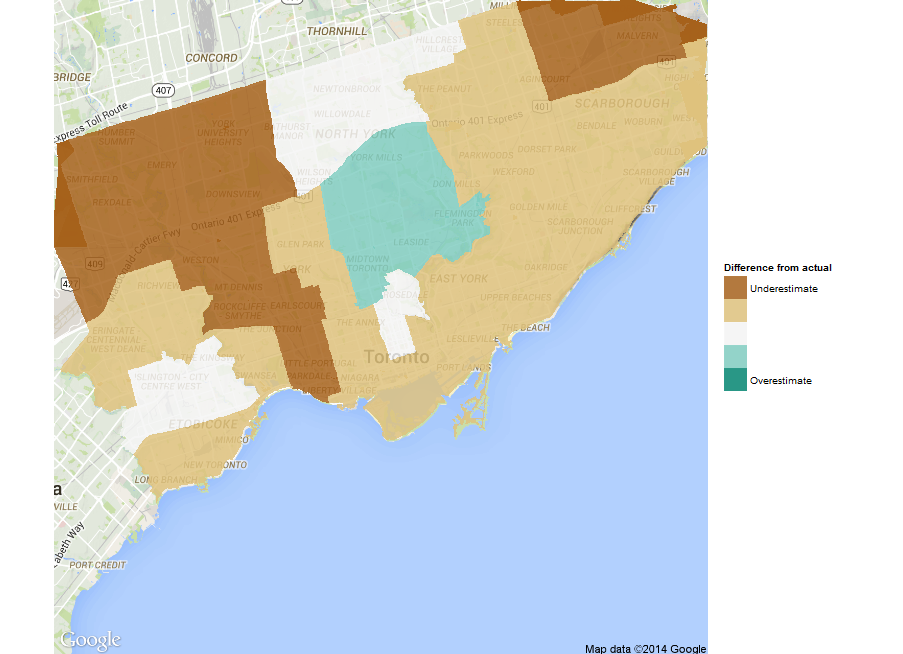
The full analysis is here. The summary is that our estimates weren’t too bad on average: the distribution of errors is centered on zero (i.e., not biased) with a small standard error. But, on-average estimates are not sufficient for the types of prediction we would like to make. At a ward-level, we find that we generally overestimated support for Tory, especially in areas where Ford received significant votes.
We understood that our simple agent-based approach wouldn’t be enough. Now we’re particularly motivated to gather up much more data to enrich our agents’ behaviour and make better predictions.
The results are in, and our predictions performed reasonably well on average (we averaged 4% off per candidate). Ward by ward predictions were a little more mixed, though, with some wards being bang on (looking at Tory’s results), and some being way off – such as northern Scarborough and Etobicoke. (For what it’s worth, the polls were a ways off in this regard too.) This mostly comes down to our agents not being different enough from one another. We knew building the agents would be the hardest part, and we now have proof!
Regardless, we still think that the agent-based modeling approach is the most appropriate for this kind of work – but we obviously need a lot more data to teach our agents what they believe. So, we’re going to spend the next few months incorporating other datasets (e.g., historical federal and provincial elections, as well as councillor-level data from the 2014 Toronto election). The other piece that we need to focus on is turnout. We knew our turnout predictions were likely the minimum for this election, but aren’t yet able to model a more predictive metric, so we’ll be conducting a study into that as well.
Finally, we’ll provide detailed analysis of our predictions once all the detailed official results become available.
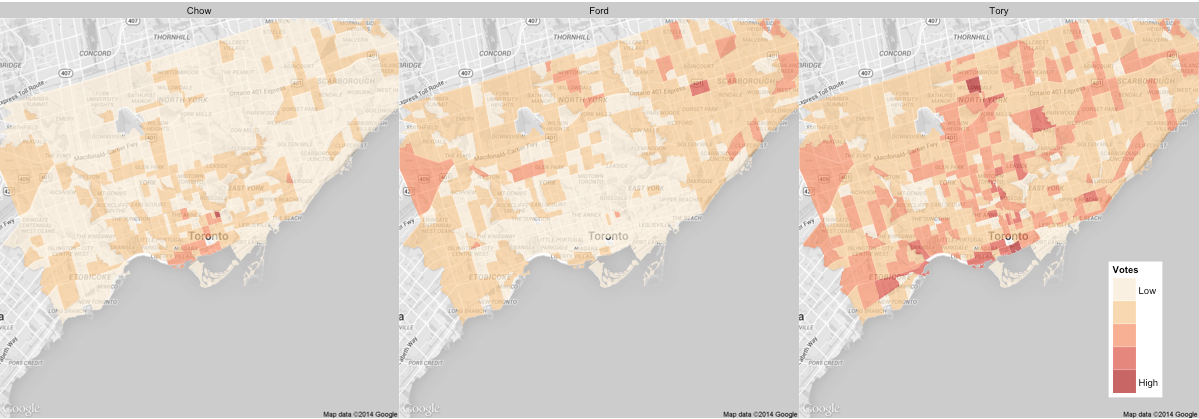
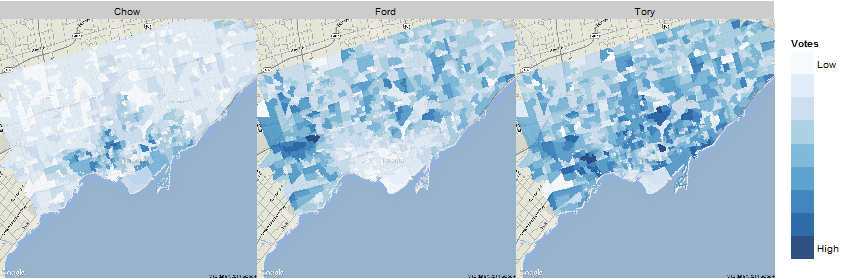
Our final predictions have John Tory winning the 2014 mayoral election in Toronto with a plurality 46% of the votes, followed by Doug Ford (29%) and Olivia Chow (25%). We also predict turnout of at least 49% across the city, but there are differences in turnout among each candidate’s supporters (with Tory’s supporters being the most likely to vote by a significant margin - which is why our results are more in his favour than recent polls). We predict support for each candidate will come from different pockets of the city, as can be seen on the map below.
These predictions were generated by simulating the election ten times, each time sampling one million of our representative voters (whom we created) for their voting preferences and whether they intend to vote.
Each representative voter has demographic characteristics (e.g., age, sex, income) in accordance with local census data, and lives in a specific ‘neighbourhood’ (i.e., census tract). These attributes helped us assign them political beliefs – and therefore preferences for candidates – as well as political engagement scores that come from various studies of historical turnout (from the likes of Elections Canada). The latter allows us to estimate the likelihood of each specific agent actually casting a ballot.
We’ll shortly also release a ward-by-ward summary of our predictions.
In the end, we hope this proof-of-concept proves to be a more refined (and therefore useful in the long-term) than polling data. As the model becomes more sophisticated, we’ll be able to do scenario testing and study other aspects of campaigns.
As promised, here is a ward-by-ward breakdown of our final predictions for the 2014 mayoral election in Toronto. We have Tory garnering the most votes in 33 wards for sure, plus likely another 5 in close races. Six wards are “too close to call”, with three barely leaning to Tory (38, 39, and 40) and three barely leaning to Ford (8, 35, and 43). We’re not predicting Chow will win in any ward, but will come second in fourteen.
The first (and long) step in moving towards agent-based modeling is the creation of the agents themselves. While fictional, they must be representative of reality – meaning they need to behave like actual people might.
In developing a proof of concept of our simulation platform (which we’ll lay out in some detail soon), we’ve created 10,000 agents, drawn randomly from the 542 census tracts (CTs) that make up Toronto per the 2011 Census, proportional to the actual population by age and sex. (CTs are roughly “neighbourhoods”.) So, for example, if 0.001% of the population of Toronto are male, aged 43, living in a CT on the Danforth, then roughly 0.001% of our agents will have those same characteristics. Once the basic agents are selected, we assign (for now) the median household income from the CT to the agent.
But what do these agents believe, politically? For that we take (again, for now) a weighted compilation of relatively recent polls (10 in total, having polled close to 15,000 people, since Doug Ford entered the race), averaged by age/sex /income group/region combinations (420 in total). These give us average support for each of the three major candidates (plus “other”) by agent type, which we then randomly sample (by proportion of support) and assign a Left-Right score (0-100) as we did in our other modeling.
This is somewhat akin to polling, except we’re (randomly) assigning these agents what they believe rather than asking, such that it aggregates back to what the polls are saying, on average.
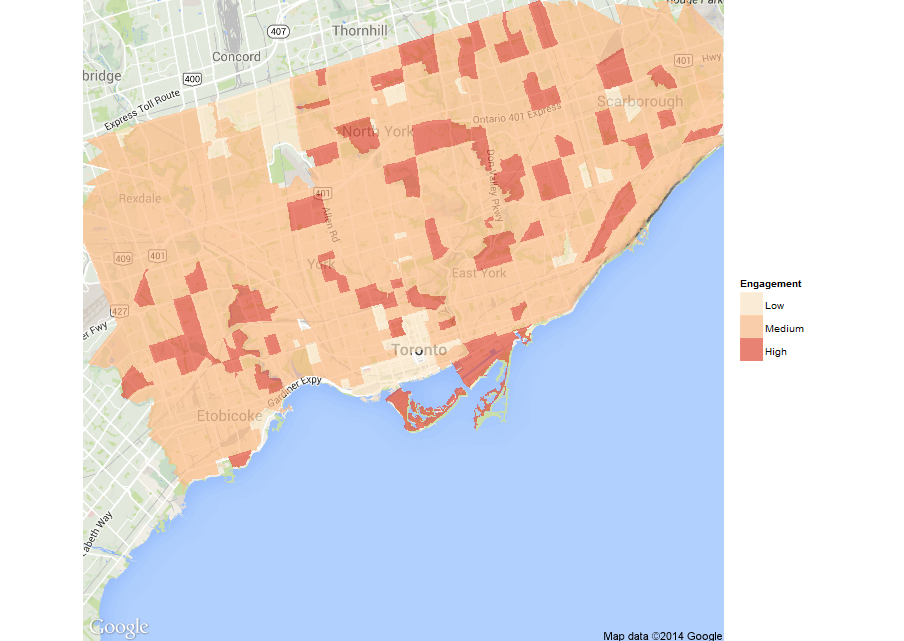
Next, we take the results of an Elections Canada study on turnout by age/sex that allows us to similarly assign “engagement” scores to the agents. That is, we assign (for now) the average turnout by age/sex group accordingly to each agent. This gives us a sense of likely turnout by CT (see map below).
There is much more to go here, but this forms the basis of our “voter” agents. Next, we’ll turn to “candidate” agents, and then on to “media” agents.
Our most recent analysis shows Tory still in the lead with 44% of the votes, followed by Doug Ford at 33% and Olivia Chow at 23%.
Our analytical approach allows us to take a closer, geographical look. Based on this, we see general support for Tory across the city, while Ford and Chow have more distinct areas of support.
This still based on our original macro-level analysis, but gives a good sense of where our agents support would be (on average) at a local level.
Given the caveats we outlined re: macro-level voting modeling, we’re moving on to a totally different approach. Using something called agent-based modeling (ABM), we’re hoping to move to a point where we can both predict elections, but also use the system to conduct studies on the effectiveness of various election models.
ABM can be defined simply as an individual-centric approach to model design, and has become widespread in multiple fields, from biology to economics. In such models, researchers define agents (e.g., voters, candidates, and media) each with various properties, and an environment in which such agents can behave and interact.
Examining systems through ABM seeks to answer four questions:
Empirical: What are the (causal) explanations for how systems evolve?
Heuristic: What are outcomes of (even simple) shocks to the system?
Method: How can we advance our understanding of the system?
Normative: How can systems be designed better?
We’ll start to provide updates on our progress on the development on our system in the coming weeks.
Based on updated poll numbers (per Threehundredeight.com as of September 16) - where John Tory has a commanding lead - we’re predicting that the wards to watch in the upcoming Toronto mayoral election are clustered in two areas, surprisingly, traditional strongholds for Doug Ford and Olivia Chow.
The first set are Etobicoke North & Centre (wards 1-4), traditional Ford territory. The second are in the south-west portion of downtown, traditional NDP territory, specifically Parkdale-High Park, Davenport, Trinity-Spadina (x2), and Toronto Danforth (respectively wards 14, 18-20, and 30).
As the election gets closer, we’ll provide more detailed predictions.
As with any analytical project, we invested significant time in obtaining and integrating data for our neighbourhood-level modeling. The Toronto Open Data portal provides detailed election results for the 2003, 2006, and 2010 elections, which is a great resource. But, they are saved as Excel files with a separate worksheet for each ward. This is not an ideal format for working with R.
We’ve taken the Excel files for the mayoral-race results and converted them into a data package for R called toVotes. This package includes the votes received by ward and area for each mayoral candidate in each of the last three elections.
If you’re interested in analyzing Toronto’s elections, we hope you find this package useful. We’re also happy to take suggestions (or code contributions) on the GitHub page.
In our first paper, we describe the results of some initial modeling - at a neighbourhood level - of which candidates voters are likely to support in the 2014 Toronto mayoral race. All of our data is based upon publicly available sources.
We use a combination of proximity voter theory and statistical techniques (linear regression and principal-component analyses) to undertake two streams of analysis:
Determining what issues have historically driven votes and what positions neighbourhoods have taken on those issues
Determining which neighbourhood characteristics might explain why people favour certain candidates
In both cases we use candidates’ currently stated positions on issues and assign them scores from 0 (‘extreme left’) to 100 (‘extreme right’). While certainly subjective, there is at least internal consistency to such modeling.
This work demonstrates that significant insights on the upcoming mayoral election in Toronto can be obtained from an analysis of publicly available data. In particular, we find that:
Voters will change their minds in response to issues. So, “getting out the vote” is not a sufficient strategy. Carefully chosen positions and persuasion are also important.
Despite this, the ‘voteability’ of candidates is clearly important, which includes voter’s assessments of a candidate’s ability to lead and how well they know the candidate’s positions.
The airport expansion and transportation have been the dominant issues across the city in the last three elections, though they may not be in 2014.
A combination of family size, mode of commuting, and home values (at the neighbourhood level) can partially predict voting patterns.
We are now moving on to something completely different, where we use an agent-based approach to simulate entire elections. We are actively working on this now and hope to share our progress soon.
Political campaigns have limited resources -–both time and financial - that should be spent on attracting voters that are more likely to support their candidates. Identifying these voters can be critical to the success of a candidate.
Given the privacy of voting and the lack of useful surveys, there are few options for identifying individual voter preferences:
Polling, which is large-scale, but does not identify individual voters
Voter databases, which identify individual voters, but are typically very small scale
In-depth analytical modeling, which is both large-scale and helps to ‘identify’ voters (at least at a neighbourhood level on average)
The goal of PsephoAnalytics* is to model voting behaviour in order to accurately explain campaigns (starting with the 2014 Toronto mayoral race). This means attempting to answer four key questions:
What are the (causal) explanations for how election campaigns evolve – and how well can we predict their outcomes?
What are effects of (even simple) shocks to election campaigns?
How can we advance our understanding of election campaigns?
How can elections be better designed?
Psephology (from the Greek psephos, for ‘pebble’, which the ancient Greeks used as ballots) deals with the analysis of elections.