Lucy couldn’t quite manage the last burpee challenge in today’s One Academy Collision class

Lucy couldn’t quite manage the last burpee challenge in today’s One Academy Collision class
My favourite gym has a charity event on Saturday supporting Nellie’s Shelter for women & children. If you’re new to One Academy, your first class if free! So, a great chance to get a good workout & support an important cause
I’m really enjoying these Biggest Ideas in the Universe videos from Sean Carroll. Sufficiently nerdy to be interesting without getting too detailed.
Lots of good 90s music nostalgia on this Incomparable episode
China Miéville’s Perdido Street Station is intensely creative and very entertaining 📚
A big thanks to Brie and Paul for the homemade masks!

I’m neither an epidemiologist nor a medical doctor. So, no one wants to see my amateur disease modelling.
That said, I’ve complained in the past about Ontario’s open data practices. So, I was very impressed with the usefulness of the data the Province is providing for COVID: a straightforward csv file that is regularly updated from a stable URL.
Using the data is easy. Here’s an example of creating a table of daily counts and cumulative totals:
data_source <- "[data.ontario.ca/dataset/f...](https://data.ontario.ca/dataset/f4112442-bdc8-45d2-be3c-12efae72fb27/resource/455fd63b-603d-4608-8216-7d8647f43350/download/conposcovidloc.csv)"
covid_data <- read_csv(data_source) %>%
  select(ACCURATE_EPISODE_DATE) %>%
  rename(date = ACCURATE_EPISODE_DATE) %>%
  group_by(date) %>%
  summarise(daily_count = n()) %>%
  mutate(cumulative_count = cumsum(daily_count))
From there we can make some simple plots to get a sense of how the case load is changing.
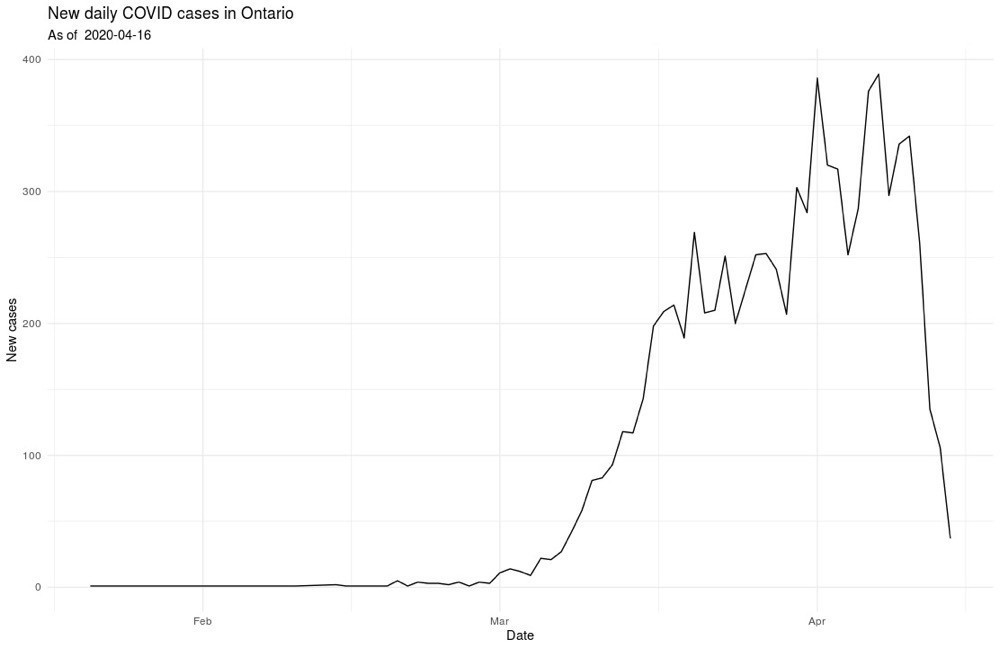
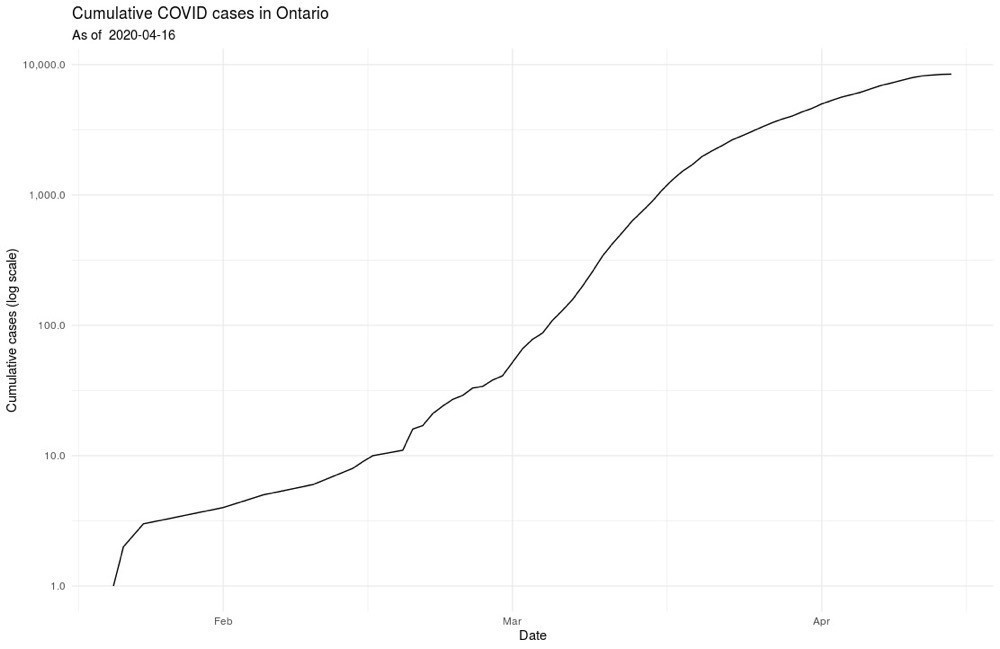
And, I’ll leave it at that, at least for public posting 🤓
Apple’s Mobility Trends tool is intriguing. Curious to see that transit declines early, quickly, and the most. Makes sense, I suppose, given that transit users are in close proximity.


What is Real by Adam Becker is a great book on the measurement problem in quantum physics. Becker writes very clearly about the actual physics of the problem and the fascinating history. Such a clear example of how science is a human endeavour with politics and personalities 🔭📚
Since I’m mostly stuck inside these days, I find I’m drinking more tea than usual. So, as a modification of my brew coffee shortcut, I’ve created a brew tea shortcut.
This one is slightly more complicated, since I want to do different things depending on if the tea is caffeinated or not.
We start by making this choice:
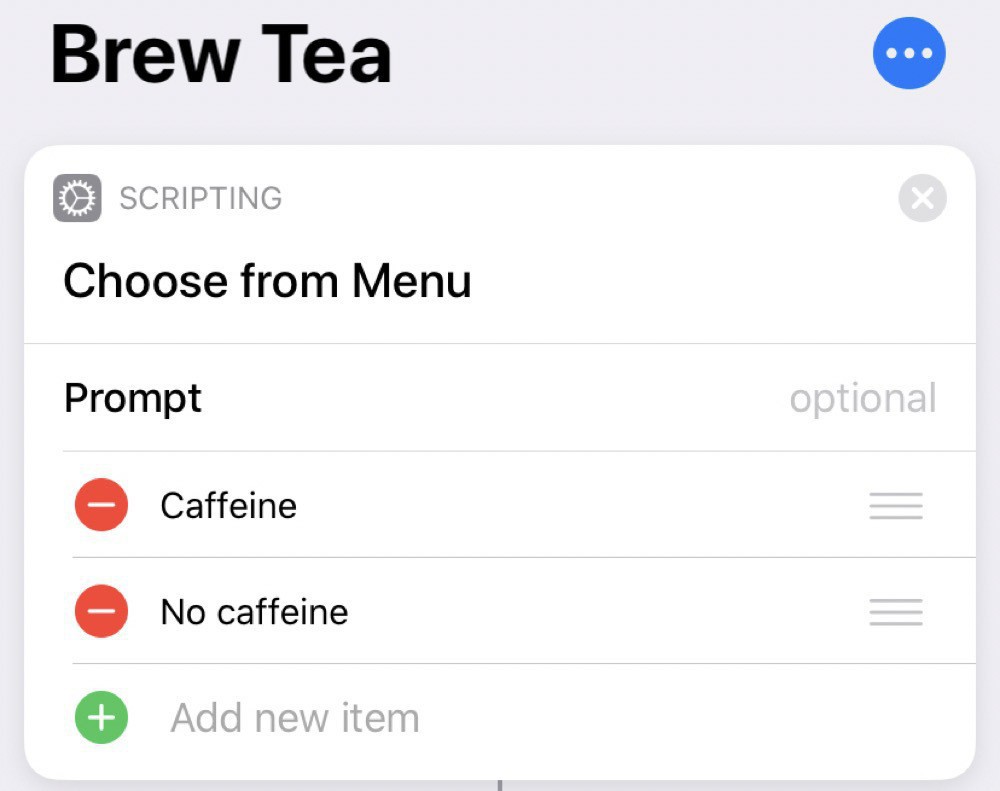
Then, if we choose caffeine, we log this to the Health app:
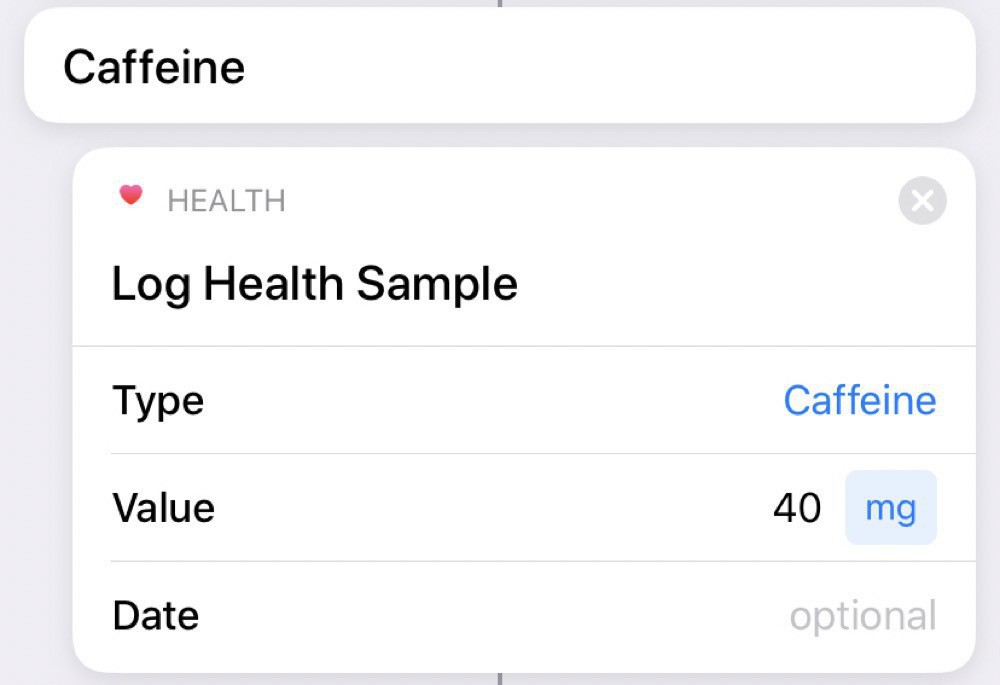
Uncaffeinated tea counts as water (at least for me):
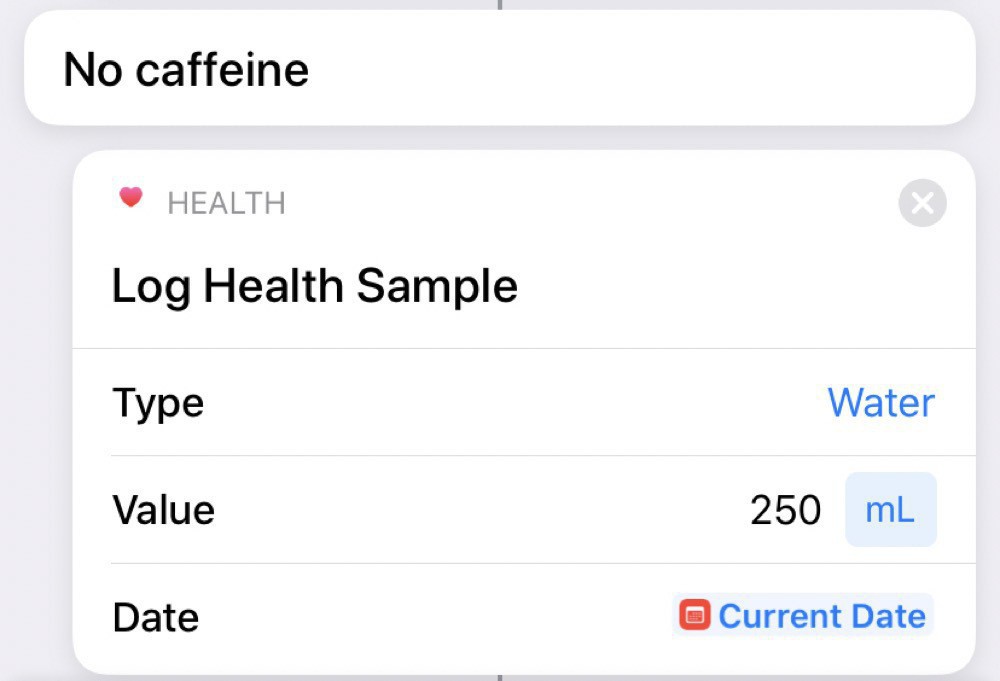
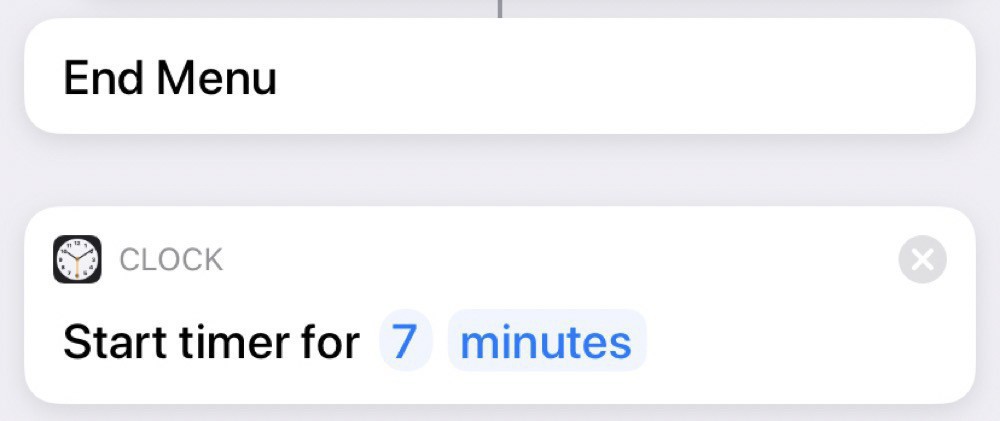
And, then, regardless of the type of tea, we set a timer for 7 minutes:
Running this one requires more interactions with Siri, since she’ll ask which type we want. We can either reply by voice or by pressing the option we want on the screen.
A small change to my quarantine home office with large ergonomic impacts: I’ve added a Lamicall iPad stand. Much better and more flexible positioning of the iPad with this simple device.


I hadn’t expected to see gas below $1/L ever again 🚗

Quarantine home gym weights 💪

I’ve been tracking my time at work for a while now, with the help of Toggl and Timery. Now that I’m working from home, work and home life are blending together, making it even more useful to track what I’m doing.
Physical exercise is essential to my sanity. So, I wanted to integrate my Apple Watch workouts into my time tracking. I thought I’d be able to leverage integration with the Health app through Shortcuts to add in workout times. Turns out you can’t access this kind of information and I had to take a more indirect route using the Automation features in Shortcuts.
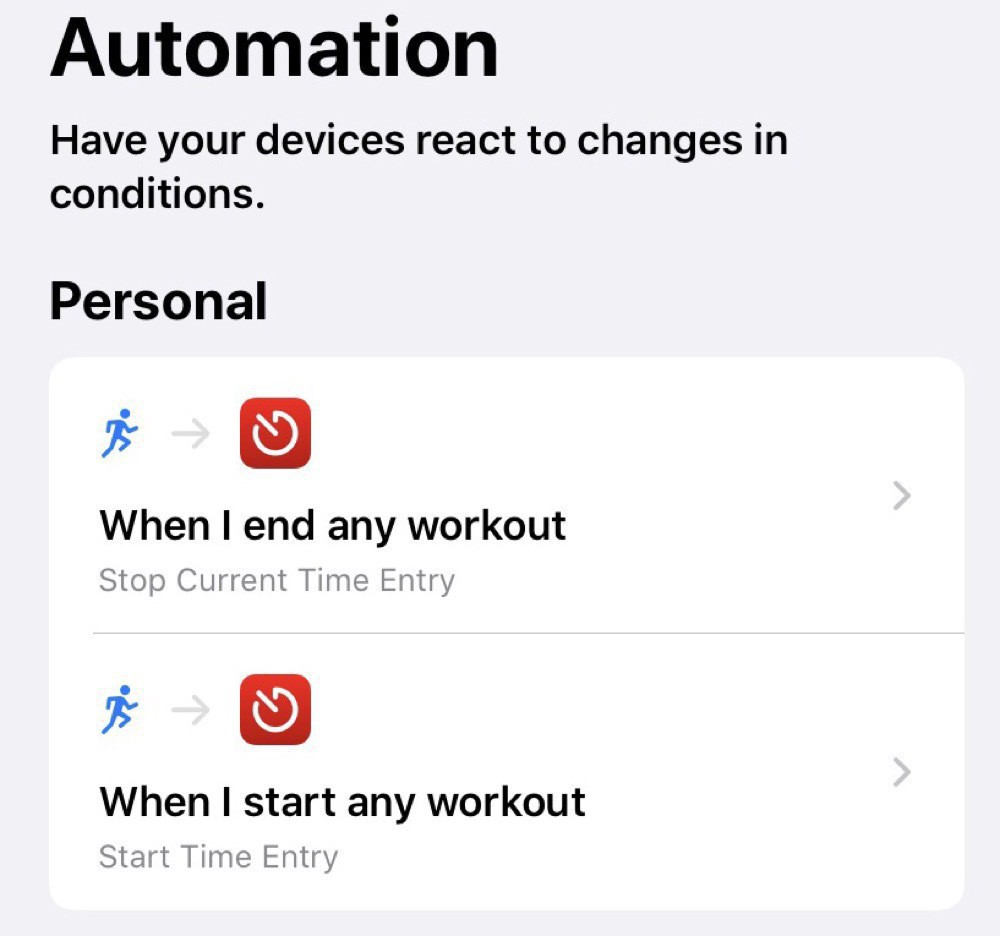
I’ve setup two automations: one for when I start an Apple Watch workout and the other for when I stop the workout:
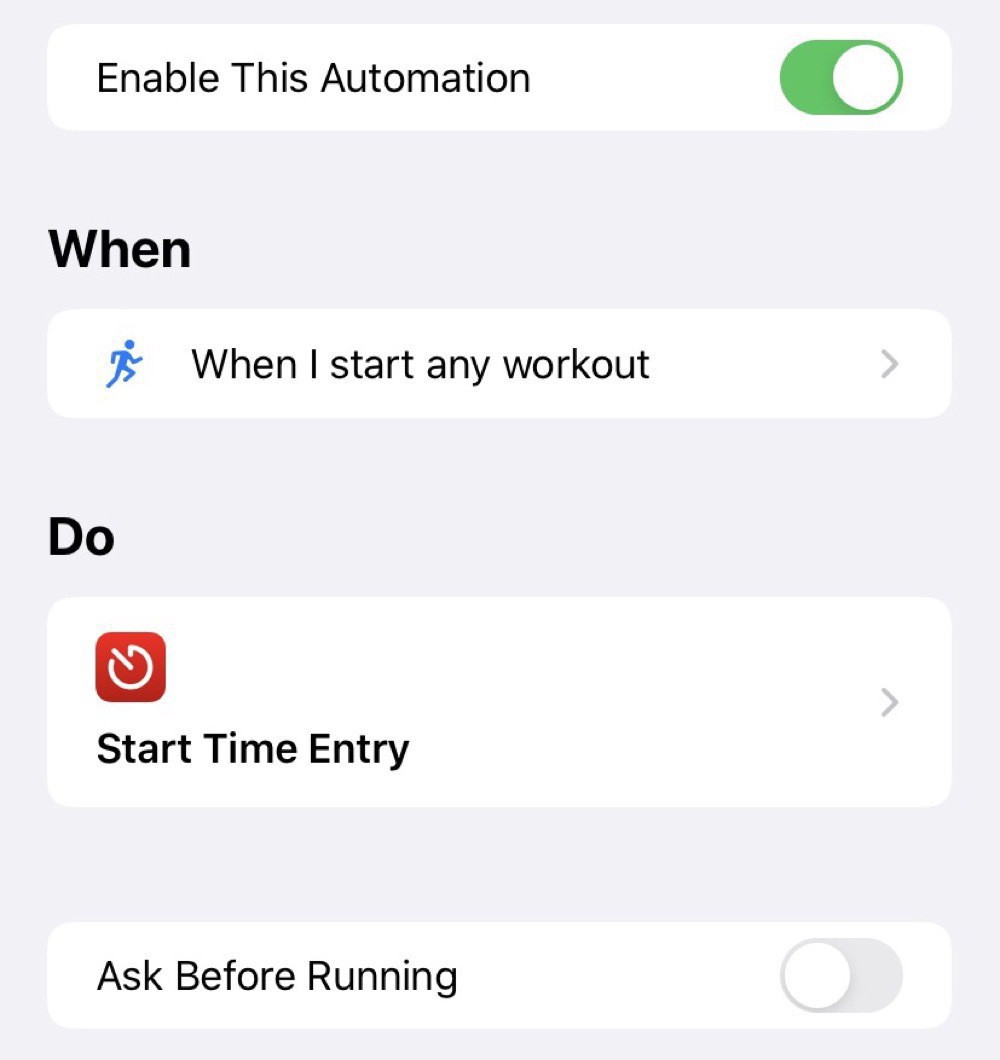
The starting automation just starts an entry in Timery:
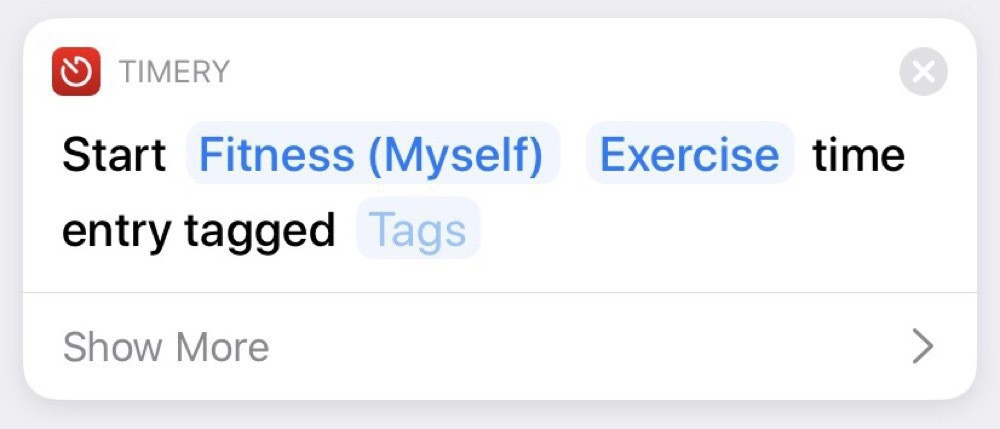
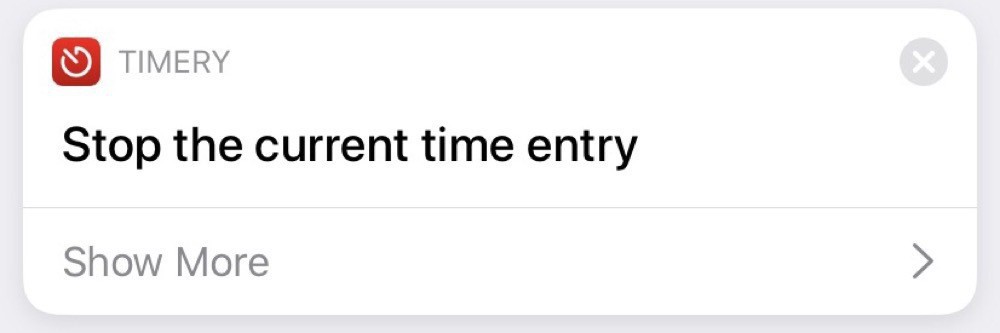
The stopping automation, unsurprisingly, stops the running entry:
As with most of my Shortcuts, this is a simple one. Developing a portfolio of these simple automations is really helpful for optimizing my processes and freeing up time for my priorities.
The face you make when you’re dealt 23 damage in one round

A good day for board games

I’ve found the Eno’s new album Mixing Colours really helpful while working from home under quarantine with the rest of my family. 🎧

I enjoyed Star Trek Picard. A fun mix of nostalgia, new characters, and interesting story. Plus Patrick Stewart really is a great actor. I’m glad they had a chance to complete Data’s story, after the abrupt ending in Nemesis. 📺
2 kg of coffee should keep me going in quarantine for a while ☕️

A sentence I never expected to write: A big thank you to my sister for delivering much needed toilet paper while I was in quarantine. A messy emergency was approaching 😬
