society
The Experiments in Having No Head series in Waking Up from Richard Lang are great. So, I’m glad to see new sessions added
How to fix the disaster of human roads to benefit wildlife | Aeon Essays
Unbelieveable:
…about a million individuals of all species are killed every day on the roads of the US. In North America overall, the cumulative scale of all this roadkill now surpasses hunting as the main cause of death in larger species
As bad as that is, the impact roads have on dissecting land up into small islands is even worse for species’ habitats. The article goes on to describe some of the initiatives underway to reduce the impacts of this “sprawling web”.
Year of the Tangible
Inspired by Coretex, I’m declaring Tangible as my theme for 2021.
I’ve chosen this theme because I want to spend less time looking at a screen and more time with “tangible stuff”. I’m sure that this is a common sentiment and declaring this theme will keep me focused on improvements.
Since working from home with an iPad, I’m averaging about 9 hours a day with an iOS device. This isn’t just a vague estimate; Screen Time gives me to-the-minute tracking of every app I’m actively using.
A generic day is something like:
- Exercise via Zoom in the morning
- Meditate with Waking Up on the iPhone
- Read news on my iPad while having breakfast
- Back and forth between Teams (almost 3 hours a day!) and Outlook on the iPad throughout the work day
- Learning guitar on YouTube and reading books in the iPad in the evening
Throw in some Netflix, journaling in DayOne, social networking, and random YouTube videos and I’m spending an incredible amount of time looking at a screen.
I’m certainly not a Luddite! The ability of these rectangles of glass to take on so many functions and provide so much meaningful content is astounding. There’s just something unsettling about the dominant role they play.
So, a few things I plan to try:
- Although I’ll continue reading ebooks, since the convenience is so great, I’ll be rotating paper books into the queue regularly.
- I’ve lost my running outdoor routine. Getting that back will be a nice addition to the Zoom classes and add in some very much needed fresh air.
- As a family, we’ve been enjoying playing board games on weekends, just not routinely. Making sure we play at least one game a week will be good for all of us.
- My son is keen on electronics. We’re going to try assembling a gaming PC for him from components, as well as learn some basic electronics with a breadboard and Arduino.
- Our dog will be excited to get out for more regular walks with especially long ones on the weekend.
I’ll be adding much of this to Streaks, an app that I’ve found really helpful for building habits. I’ll also add a “tangible” tag to my time tracker to quantify the shift.
My hope is that I can find the right balance of screen time and tangible activities with intention.
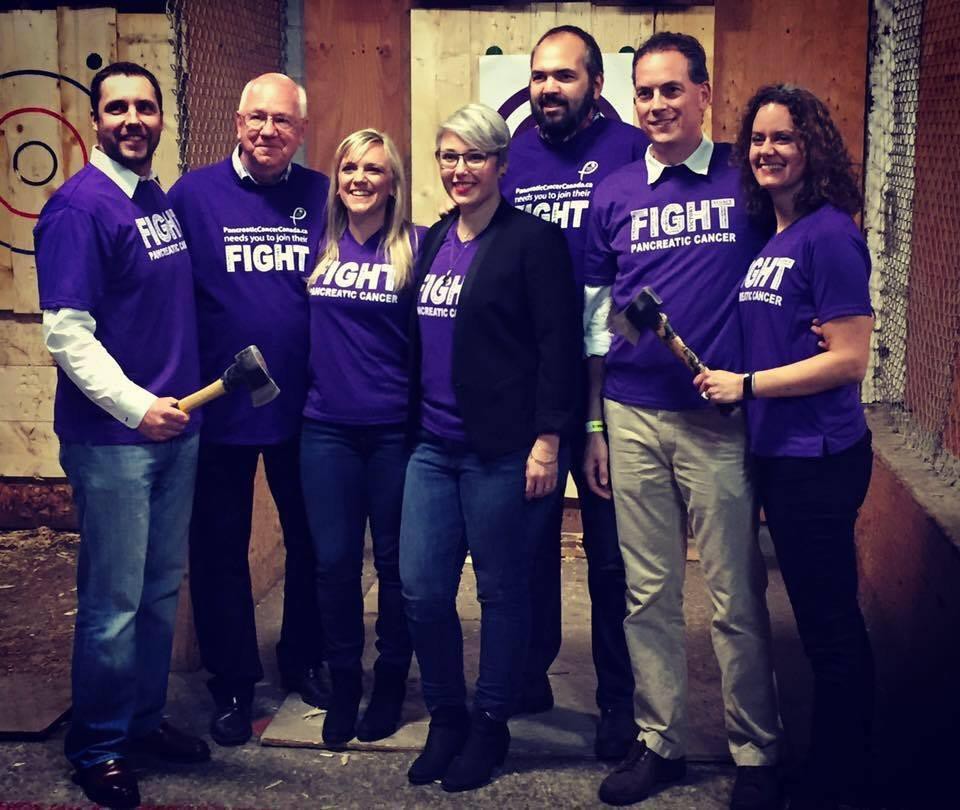
4th Axe Pancreatic Cancer fundraiser
Thanks to generous support, the 4th Axe Pancreatic Cancer fundraiser was a great success. We raised over $32K this year and all funds support the PancOne Network. So far, we’ve raised close to $120K in honour of my Mom. Thanks to everyone that has supported this important cause!

Axe Pancreatic Cancer tickets are available now! This is a very fun event for a great cause. Early Bird tickets are selling quickly. So, if you’re interested, sign up now at pancreaticcancercanada.ca/axe-pancr…

Charity donations by province
This tweet about the charitable donations by Albertans showed up in my timeline and caused a ruckus.
Albertans give the most to charity in Canada, 50% more than the national average, even in tough economic times. #CdnPoli pic.twitter.com/keKPzY8brO
— Oil Sands Action (@OilsandsAction) August 31, 2017
Many people took issue with the fact that these values weren’t adjusted for income. Seems to me that whether this is a good idea or not depends on what kind of question you’re trying to answer. Regardless, the CANSIM table includes this value. So, it is straightforward to calculate. Plus CANSIM tables have a pretty standard structure and showing how to manipulate this one serves as a good template for others.
library(tidyverse)
# Download and extract
url <- "[www20.statcan.gc.ca/tables-ta...](http://www20.statcan.gc.ca/tables-tableaux/cansim/csv/01110001-eng.zip)"
zip_file <- "01110001-eng.zip"
download.file(url,
              destfile = zip_file)
unzip(zip_file)
# We only want two of the columns. Specifying them here.
keep_data <- c("Median donations (dollars)",
               "Median total income of donors (dollars)")
cansim <- read_csv("01110001-eng.csv") %>%
  filter(DON %in% keep_data,
         is.na(`Geographical classification`)) %>% # This second filter removes anything that isn't a province or territory
  select(Ref_Date, DON, Value, GEO) %>%
  spread(DON, Value) %>%
  rename(year = Ref_Date,
         donation = `Median donations (dollars)`,
         income = `Median total income of donors (dollars)`) %>%
  mutate(donation_per_income = donation / income) %>%
  filter(year == 2015) %>%
  select(GEO, donation, donation_per_income)
cansim
## # A tibble: 16 x 3
## GEO donation donation_per_income
##
## 1 Alberta 450 0.006378455
## 2 British Columbia 430 0.007412515
## 3 Canada 300 0.005119454
## 4 Manitoba 420 0.008032129
## 5 New Brunswick 310 0.006187625
## 6 Newfoundland and Labrador 360 0.007001167
## 7 Non CMA-CA, Northwest Territories 480 0.004768528
## 8 Non CMA-CA, Yukon 310 0.004643499
## 9 Northwest Territories 400 0.003940887
## 10 Nova Scotia 340 0.006505932
## 11 Nunavut 570 0.005651398
## 12 Ontario 360 0.005856515
## 13 Prince Edward Island 400 0.008221994
## 14 Quebec 130 0.002452830
## 15 Saskatchewan 410 0.006910501
## 16 Yukon 420 0.005695688 Curious that they dropped the territories from their chart, given that Nunavut has such a high donation amount.
Now we can plot the normalized data to find how the rank order changes. We’ll add the Canadian average as a blue line for comparison.
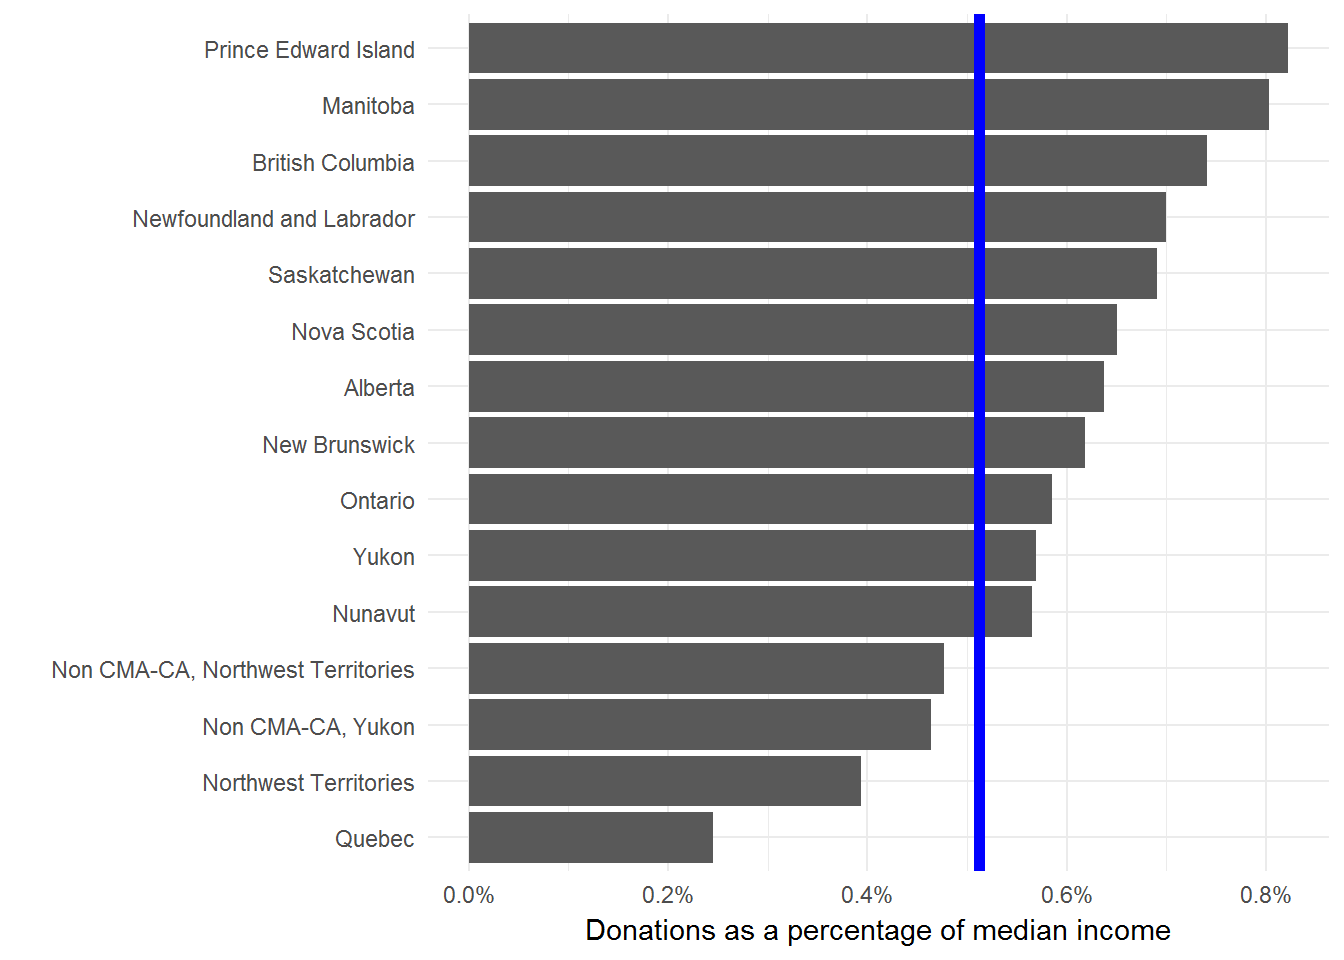
I’m not comfortable with using median donations (adjusted for income or not) to say anything in particular about the residents of a province. But, I’m always happy to look more closely at data and provide some context for public debates.
One major gap with this type of analysis is that we’re only looking at the median donations of people that donated anything at all. In other words, we aren’t considering anyone who donates nothing. We should really compare these median donations to the total population or the size of the economy. This Stats Can study is a much more thorough look at the issue.
For me the interesting result here is the dramatic difference between Quebec and the rest of the provinces. But, I don’t interpret this to mean that Quebecers are less generous than the rest of Canada. Seems more likely that there are material differences in how the Quebec economy and social safety nets are structured.
Successful AxePC 2016 event
Thank you to all the participants, donors, and volunteers for making the third Axe Pancreatic Cancer event such a great success! Together we’re raising awareness and funding to support Pancreatic Cancer Canada.
Axe PC 2016
We’re hosting our third-annual Axe Pancreatic Cancer event. Help us kick off Pancreatic Cancer Awareness Month by drinking beer and throwing axes!

I was given an opportunity to propose a measure to clarify how and on what basis the federal government allocates funds to STI - a measure that would strengthen relations between the federal government and the STI community by eliminating misunderstandings and suspicions on this point. In short, my proposal was that Ottawa direct its Science, Technology and Innovation Council to do three things:
To provide an up-to-date description of how these allocation decisions have been made in the past;
To identify the principles and sources of advice on which such decisions should be based;
To recommend the most appropriate structure and process - one characterized by transparency and openness - for making these decisions in the future.
These are reasonable suggestions from Preston Manning: be clear about why and how the Federal government funds science and technology.
Of course I may not agree with the actual decisions made through such a process, but at least I would know why the decisions were made. The current process is far too opaque and confused for such critical investment decisions.
Mama Earth Organics
I’m certain that paying attention to where my food comes from is important. Food production influences my health, has environmental consequences, and affects both urban and rural design. Ideally, I would develop relationships with local farmers, carefully choose organic produce, and always consider broad environmental impacts. Except, I like to spend time with my young family, try to get some exercise, and have more than enough commitments through work to actually spend this much effort on food choices. So, I’ve outsourced this process to the excellent Mama Earth Organics.
Every week a basket of fresh organic and/or local fruit and vegetables arrives on our doorstep. Part of the fun of this service is that different items arrive each week, which diversifies our weekly food routine. But, we always know what’s coming several days in advance, so we can plan our meals well ahead of time. After over a year of service, we’ve only had a single complaint about quality and this was handled very quickly by Mama Earth with a full refund plus credit.
We’ve found the small basket is sufficient for two adults and a picky four-year old. We’ve also added in some fresh bread from St. John’s Bakery, which has been consistently delicious and lasts through most of the week.
Death Sentences Review
Death Sentences by Don Watson is a wonderful book – simultaneously funny, scary, and inspiring – that describes how “clichés, weasel words, and management-speak” are infecting public language.
The humour comes from Watson’s acerbic commentary and fantastic scorn for phrases like:
Given the within year and budget time flexibility accorded to the science agencies in the determination of resource allocation from within their global budget, a multi-parameter approach to maintaining the agencies budgets in real terms is not appropriate.
The book is scary because it makes a strong argument for the dangers of this type of language. Citizens become confused and disinterested, customers become jaded, and people loose their love for language. Also, as a public servant I see this kind of language every day and often find myself struggling to avoid banality and cliches (not to mention bullet points). We need more forceful advocates like Don Watson to call out politicians and corporations for abusing our language. This book certainly makes me want to try harder. And what’s more inspiring than struggling for a good cause against long odds?
The book also has a great glossary of typical weasel words with possible synonyms. So, I’m keeping the book in my office for quick reference.
Omnivore
After seventeen years as a vegetarian, I recently switched back to an omnivore. My motivation for not eating meat was environmental, since, on average, a vegetarian diet requires much less land, water, and energy. This is still the right motivation, but over the last year or so I’ve been rethinking my decision to not eat meat.
My concern was that I’d stopped paying attention to my food choices and a poorly considered vegetarian diet can easily yield a bad environmental outcome. In particular, modern agriculture now takes 10 calories of fossil fuel energy to produce a single calorie of food. This is clearly unsustainable. We cannot rely on non-renewable, polluting resources for our food, nor can we continue to transport food great distances – even if it is only vegetables. My unexamined commitment to a vegetarian diet was no longer consistent with environmental sustainability.
I think the solution is to eat local, organic food. This also requires eating seasonal food, but Canadian winters are horrible for local vegetables. This left me wanting to support local agriculture, but unable to restrict my diet. Returning to my original motivation to choose environmentally appropriate food convinced me it was time to return to being an omnivore. My new policy is to follow Michael Pollan’s advice: “Eat food. Mostly plants. Not too much.” In addition, I’ll favour locally grown, organic food and include small amounts of meat – which I hope will predominantly come from carefully considered and sustainable sources. I’ve also deciced that when faced with a dillema of choosing either local or organic, I’ll choose local. We need to support local agriculture and I’ll trade this for organic if necessary. Of course, in the majority of cases local and organic options are available, and I’ll choose them.
This is a big change and I look forward to exploring food again.
Election 2008
Like most Canadians, I’ll be at the polls today for the 2008 Federal Election.
In the past several elections, I’ve cast my vote for the party with the best climate change plan. The consensus among economists is that any credible plan must set a price on carbon emissions. My personal preference is for a predictable and transparent price to influence consumer spending, so I favour a carbon tax over a cap-and-trade. Enlightening discussions of these issues are available at Worthwhile Canadian Initiative, Jeffrey Simpson’s column at the Globe and Mail, or his book Hot Air.
Until now this voting principle has meant a vote for the Green Party who support a tax shift from income to pollution. My expectation for this vote was not that the Green Party would gain any direct political power, rather their environmental plan would gain political profile and convince the Liberals and Conservatives to improve their plans. A carbon tax is now a central component of this year’s Liberal Platform with the Green Shift. Both the Conservative Pary and NDP support a limited cap-and-trade system on portions of the economy, with the Conservatives supporting dubious “intensity-based” targets.
Although I quite like the central components of the Green Shift, I’m not too keen on the distracting social engineering aspects of the plan. Furthermore, the Liberals have certainly failed to implement any of their previous climate change plans while in power. Nonetheless, I do think (hope?) they will follow through this time and I prefer supporting a well-conceived plan that may not be implemented than a poor plan. Despite my support for this plan, I think the Liberals have done a rather poor job of explaining the Green Shift and have conducted a disappointing campaign.
In the end, my principle will hold. I’m voting for the Green Shift and, reluctantly, the Liberal Party of Canada.
Stern Review on the economics of climate change
The Stern Review has been in the news recently for predicting that global warming could cost up to $7 trillion if not addressed soon. Of course, this has caused quite a stir as it offsets many of the, likely unfounded, concerns that fixing climate change will cost too much. The full report is available online and should be a quite interesting, if long, read.
TED-- Hans Rosling
An excellent presentation regarding the use of country statistics. The visualizations are particularly effective.
Resumes & Spam Filters
Since I’m looking for work, I found this post rather interesting. They’ve applied a spam filter to resumes to automatically filter through candidates. The output is only as good as the reference resumes used to construct the filter, but still an intriguing idea. My results are below. Most importantly the probability of me not being hired is 1.15e-59, which is a very, very small number. Perhaps I should add this fact to my resume?
I will now tell you what i think about this CV
The CV you entered fits better in the Hired group than the NotHired group.
CLASSIFY fails; success probability: 0.0000  pR: -58.9382
Best match to file #1 (Hired.css) prob: 1.0000  pR: 58.9382
Total features in input file: 7478
#0 (NotHired.css): features: 61899, hits: 7125, prob: 1.15e-59, pR: -58.94
#1 (Hired.css): features: 794351, hits: 90156, prob: 1.00e+00, pR:  58.94
The CV you entered fits best into the Guru catagory.
CLASSIFY succeeds; success probability: 1.0000  pR: 8.1942
Best match to file #0 (Guru.css) prob: 1.0000  pR: 8.1942
Total features in input file: 7478
#0 (Guru.css): features: 559355, hits: 66154, prob: 1.00e-00, pR:   8.19
#1 (Intergrator.css): features: 163555, hits: 17093, prob: 2.17e-29, pR: -28.66
#2 (Administrator.css): features: 241282, hits: 24729, prob: 8.45e-25, pR: -24.07
#3 (Developer.css): features: 485579, hits: 54104, prob: 6.39e-09, pR:  -8.19
Heart of the Matter
CBC’s Ideas has been running a series of shows on heart disease called “Heart of the Matter”. Episode 2 is particularly interesting from a statistical perspective, as the episode discusses several difficulties with the analysis of drug efficacy. Some highlights include:
Effect sizes Some of the best cited studies for the use of drugs to treat heart disease show a statistically significant effect of only a few percentage points improvement. Contrast this with a dramatic, vastly superior improvement from diet alone.
Response variables The focus of many drug studies has been on the reduction of cholesterol, rather than reductions in heart disease. Diet studies, for example, have shown dramatic improvements in reducing heart attacks while having no effect on cholesterol levels. Conversely, drug studies that show a reduction in cholesterol show no change in mortality rates.
Blocking of data Separate analyses of drug efficacy on female or elderly patients tend to show that drug therapy increases overall mortality. Lumping these data in with the traditional middle-aged male patients removes this effect and, instead, shows a significant decrease in heart disease with drug use.
The point here isn’t to make a comment on the influence of drug companies on medical research. Rather, such statistical concerns are common to all research disciplines. The primary concern of such analyses should be: what is the magnitude of the effect of a specific treatment on my variable of interest? The studies discussed in the Ideas program suggest that much effort has been devoted to detecting significant effects of drugs on surrogate response variables regardless of the size of the effect.
Intelligent design in the classroom
Now that intelligent design is back in the Canadian news, we should consider (again!) the consequences of teaching intelligent design in the classroom.
Intelligent design makes two postulates:
Complexity cannot be explained by science.
Given 1, complexity comes from an intelligent designer.
Now, consider a science exam in any subject and the danger of intelligent design being taught in school becomes apparent.
Physics question: Why does the earth orbit the sun?
ID answer: Because of the unnamed intelligence.
Science answer: General relativity.
Geology question: What creates mountains?
ID answer: The unnamed intelligence.
Science answer: Plate tectonics
Biology question: Why are all species on Earth connected through common descent?
ID answer: The unnamed intelligence did it.
Science answer: Evolution.
Don’t be fooled that the creationist agenda ends with biology. They intend to reduce science education to: That’s really complicated; God did it.
Climate change and public relations
A recent column in the Globe & Mail reminded me of our Federal Government’s plan for reducing greenhouse gas emissions: the One Tonne Challenge.
This campaign challenges each Canadian to reduce their contribution to greenhouse gas emissions by one tonne. The first step is to calculate your emissions and then implement recommendations for reductions. According to the online calculator, Kelly & I combined emit 4.23 tonnes annually. Fortunately, this is below the national average of 5.5 tonnes per person and significantly better than Alberta’s average of 8 tonnes per person. Still, we could do better. However, the suggestions provided aren’t much help. They largely concern implementing energy savings to our home — which we rent and have little control over. Here are the suggestions I could implement:
- Take a 5-minute shower instead of a bath.
- Turn off lights when a room is not in use.
- Use a cold water wash and rinse instead of warm or hot water to wash your clothes.
- Replace standard light bulbs with compact fluorescent light bulbs where lights are on for three or more hours at a time.
The website has a variety of good suggestions. The trick is convincing Canadian’s to assume some responsibility for climate change. Monetary incentives seem like the best strategy, but those are not currently under consideration.
The Crusade Against Evolution
An interesting read from Wired News – The Crusade Against Evolution. In addition, the Panda’s thumb has been following and carefully dissecting the recent controversy over an intelligent design paper being published in a peer-reviewed journal. The evolution-creation debate seems to be resurfacing after a short time off. The debate is important and the intelligent design supporters have to be countered, but their arguments have become hackneyed.