Charity donations by province
This tweet about the charitable donations by Albertans showed up in my timeline and caused a ruckus.
Albertans give the most to charity in Canada, 50% more than the national average, even in tough economic times. #CdnPoli pic.twitter.com/keKPzY8brO
— Oil Sands Action (@OilsandsAction) August 31, 2017
Many people took issue with the fact that these values weren’t adjusted for income. Seems to me that whether this is a good idea or not depends on what kind of question you’re trying to answer. Regardless, the CANSIM table includes this value. So, it is straightforward to calculate. Plus CANSIM tables have a pretty standard structure and showing how to manipulate this one serves as a good template for others.
library(tidyverse)
# Download and extract
url <- "[www20.statcan.gc.ca/tables-ta...](http://www20.statcan.gc.ca/tables-tableaux/cansim/csv/01110001-eng.zip)"
zip_file <- "01110001-eng.zip"
download.file(url,
              destfile = zip_file)
unzip(zip_file)
# We only want two of the columns. Specifying them here.
keep_data <- c("Median donations (dollars)",
               "Median total income of donors (dollars)")
cansim <- read_csv("01110001-eng.csv") %>%
  filter(DON %in% keep_data,
         is.na(`Geographical classification`)) %>% # This second filter removes anything that isn't a province or territory
  select(Ref_Date, DON, Value, GEO) %>%
  spread(DON, Value) %>%
  rename(year = Ref_Date,
         donation = `Median donations (dollars)`,
         income = `Median total income of donors (dollars)`) %>%
  mutate(donation_per_income = donation / income) %>%
  filter(year == 2015) %>%
  select(GEO, donation, donation_per_income)
cansim
## # A tibble: 16 x 3
## GEO donation donation_per_income
##
## 1 Alberta 450 0.006378455
## 2 British Columbia 430 0.007412515
## 3 Canada 300 0.005119454
## 4 Manitoba 420 0.008032129
## 5 New Brunswick 310 0.006187625
## 6 Newfoundland and Labrador 360 0.007001167
## 7 Non CMA-CA, Northwest Territories 480 0.004768528
## 8 Non CMA-CA, Yukon 310 0.004643499
## 9 Northwest Territories 400 0.003940887
## 10 Nova Scotia 340 0.006505932
## 11 Nunavut 570 0.005651398
## 12 Ontario 360 0.005856515
## 13 Prince Edward Island 400 0.008221994
## 14 Quebec 130 0.002452830
## 15 Saskatchewan 410 0.006910501
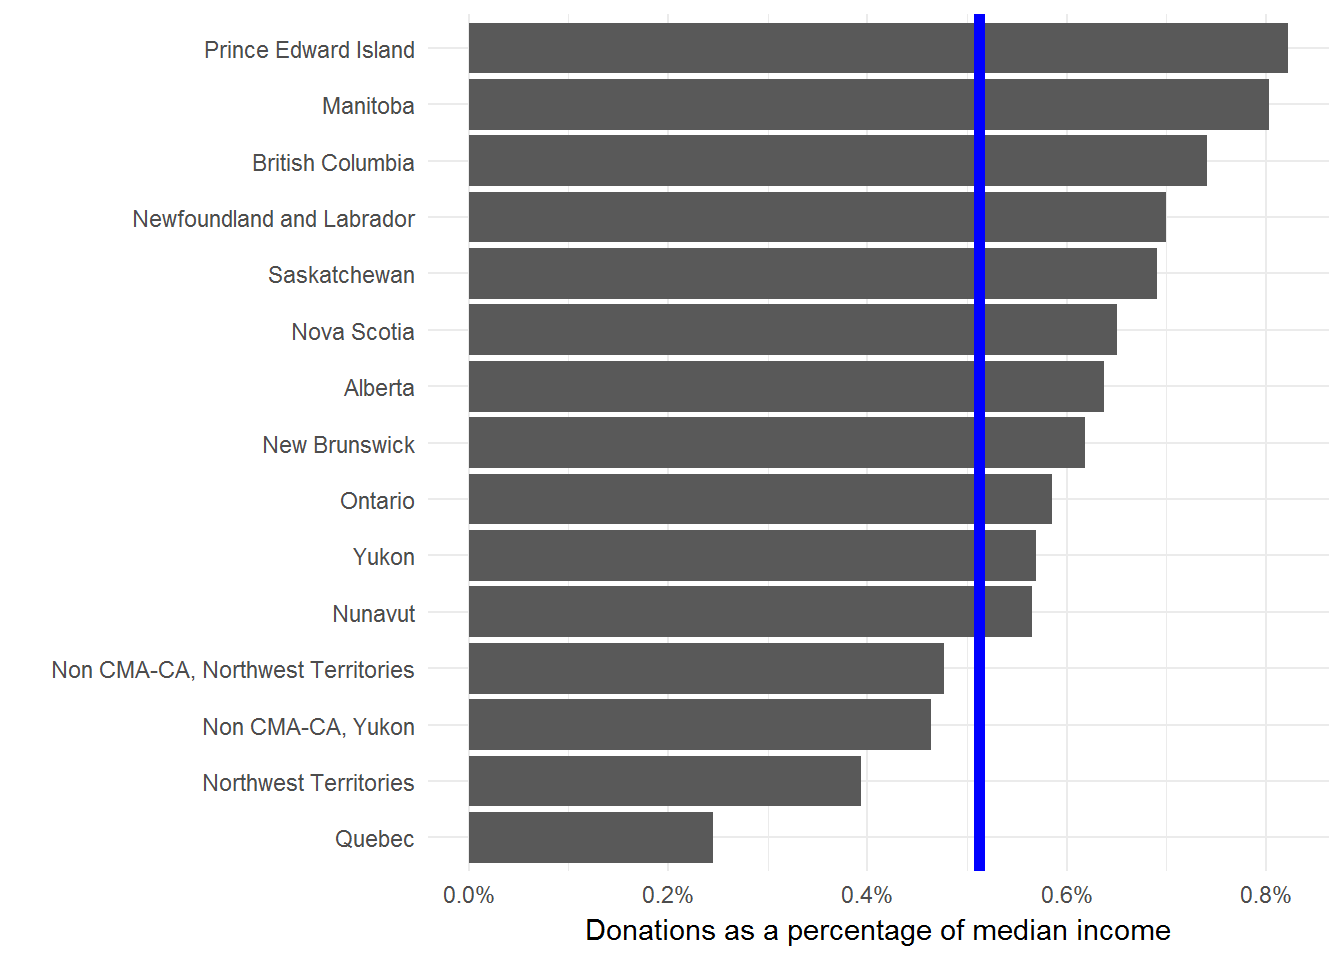
## 16 Yukon 420 0.005695688 Curious that they dropped the territories from their chart, given that Nunavut has such a high donation amount.
Now we can plot the normalized data to find how the rank order changes. We’ll add the Canadian average as a blue line for comparison.
I’m not comfortable with using median donations (adjusted for income or not) to say anything in particular about the residents of a province. But, I’m always happy to look more closely at data and provide some context for public debates.
One major gap with this type of analysis is that we’re only looking at the median donations of people that donated anything at all. In other words, we aren’t considering anyone who donates nothing. We should really compare these median donations to the total population or the size of the economy. This Stats Can study is a much more thorough look at the issue.
For me the interesting result here is the dramatic difference between Quebec and the rest of the provinces. But, I don’t interpret this to mean that Quebecers are less generous than the rest of Canada. Seems more likely that there are material differences in how the Quebec economy and social safety nets are structured.