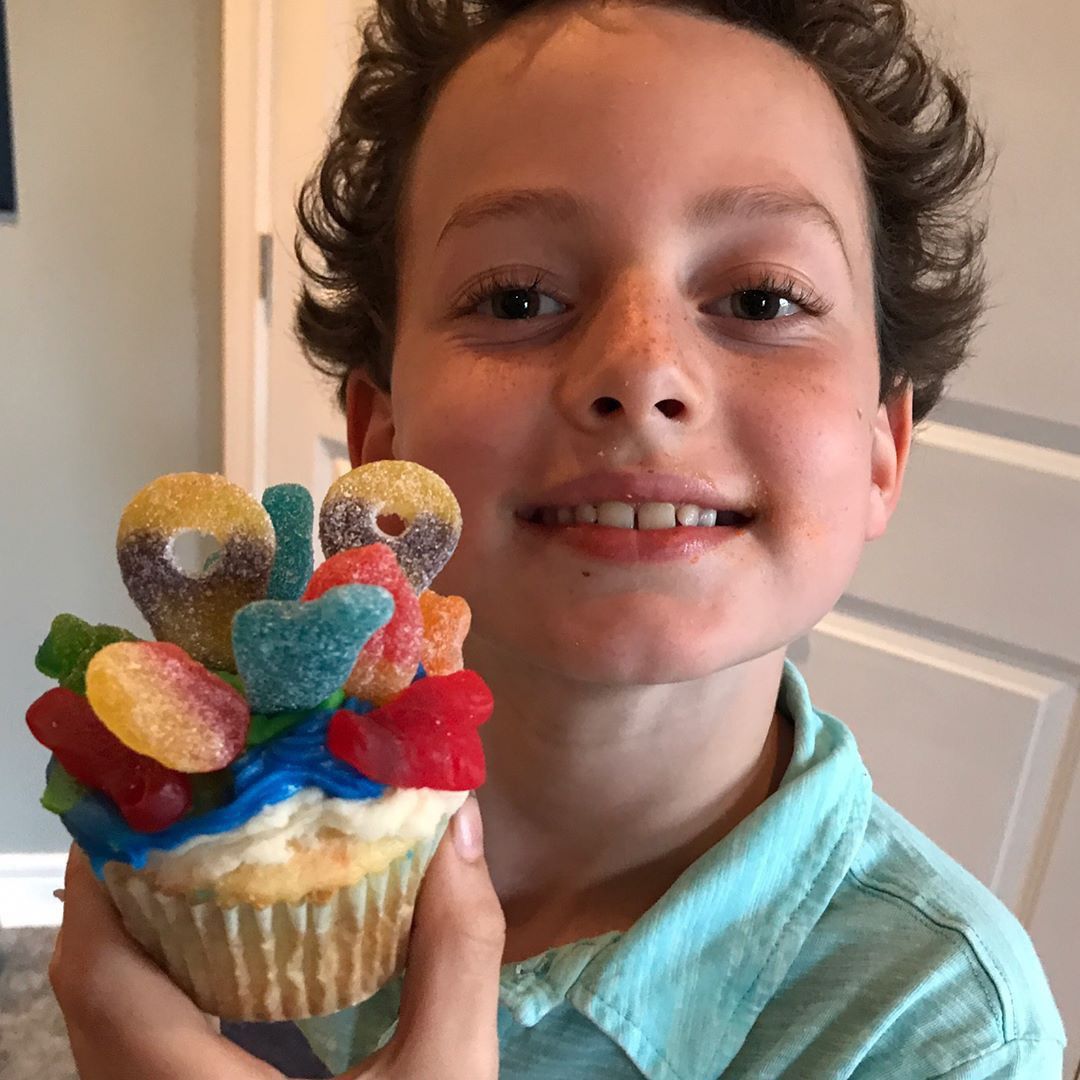
Owen’s birthday cake
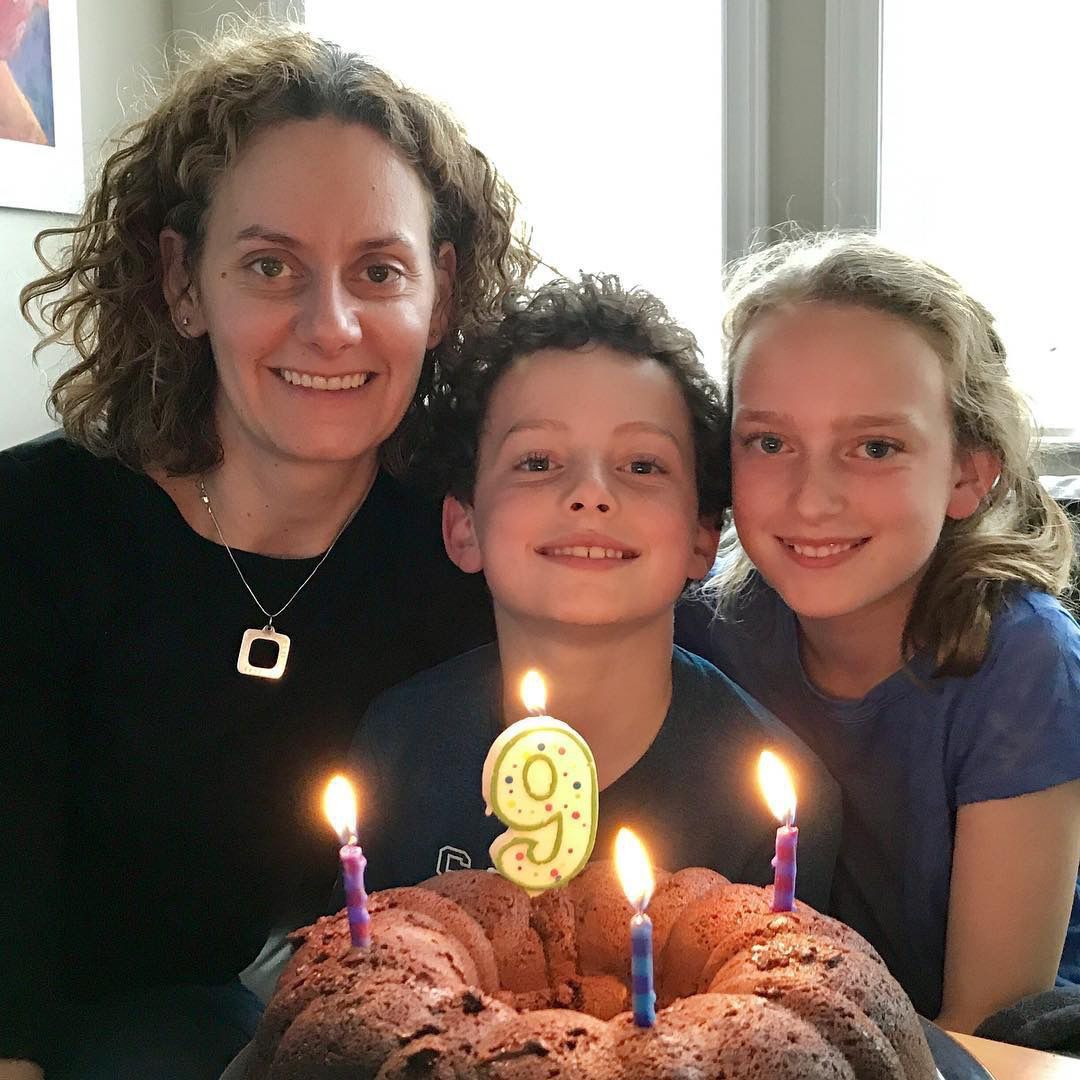
Owen’s birthday cake
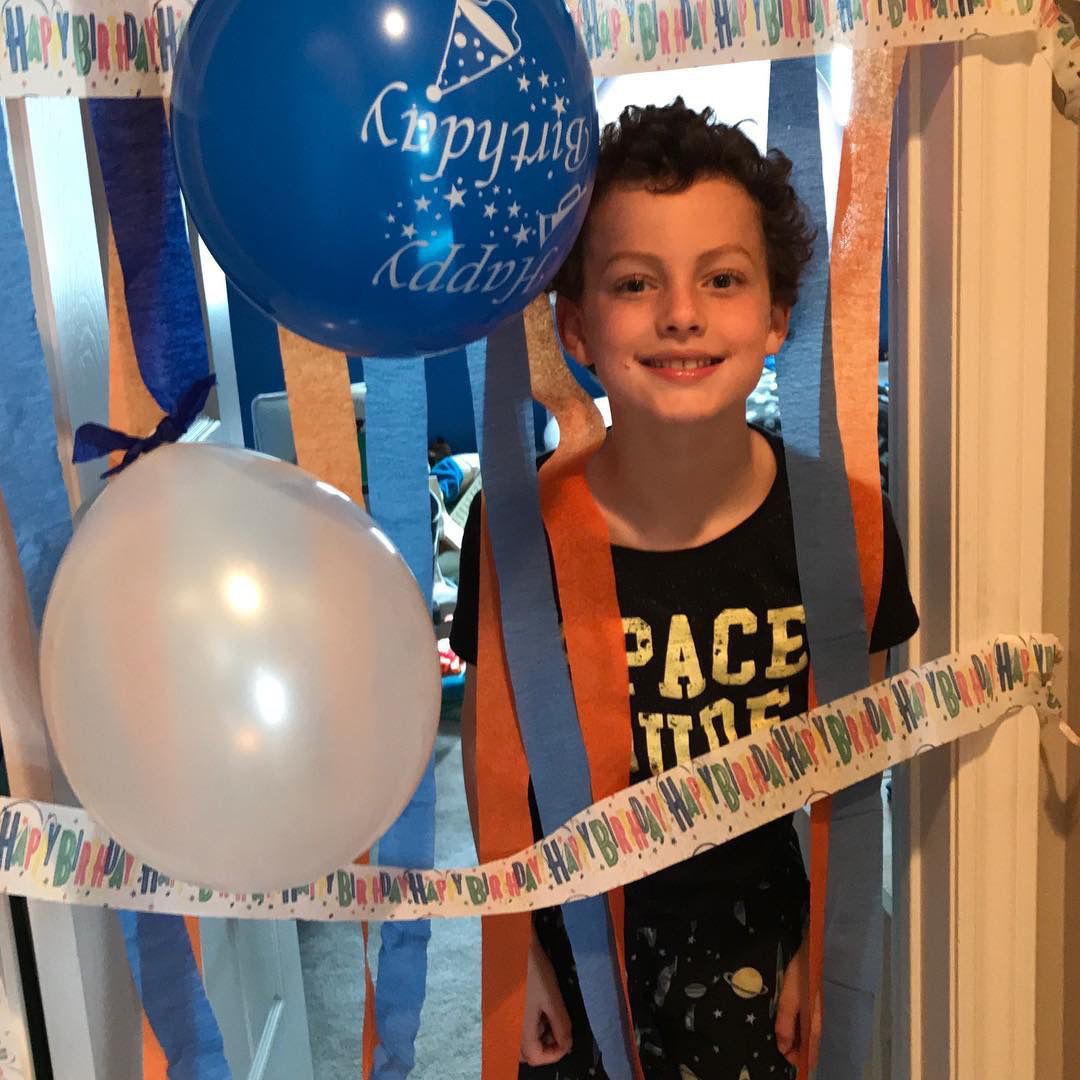
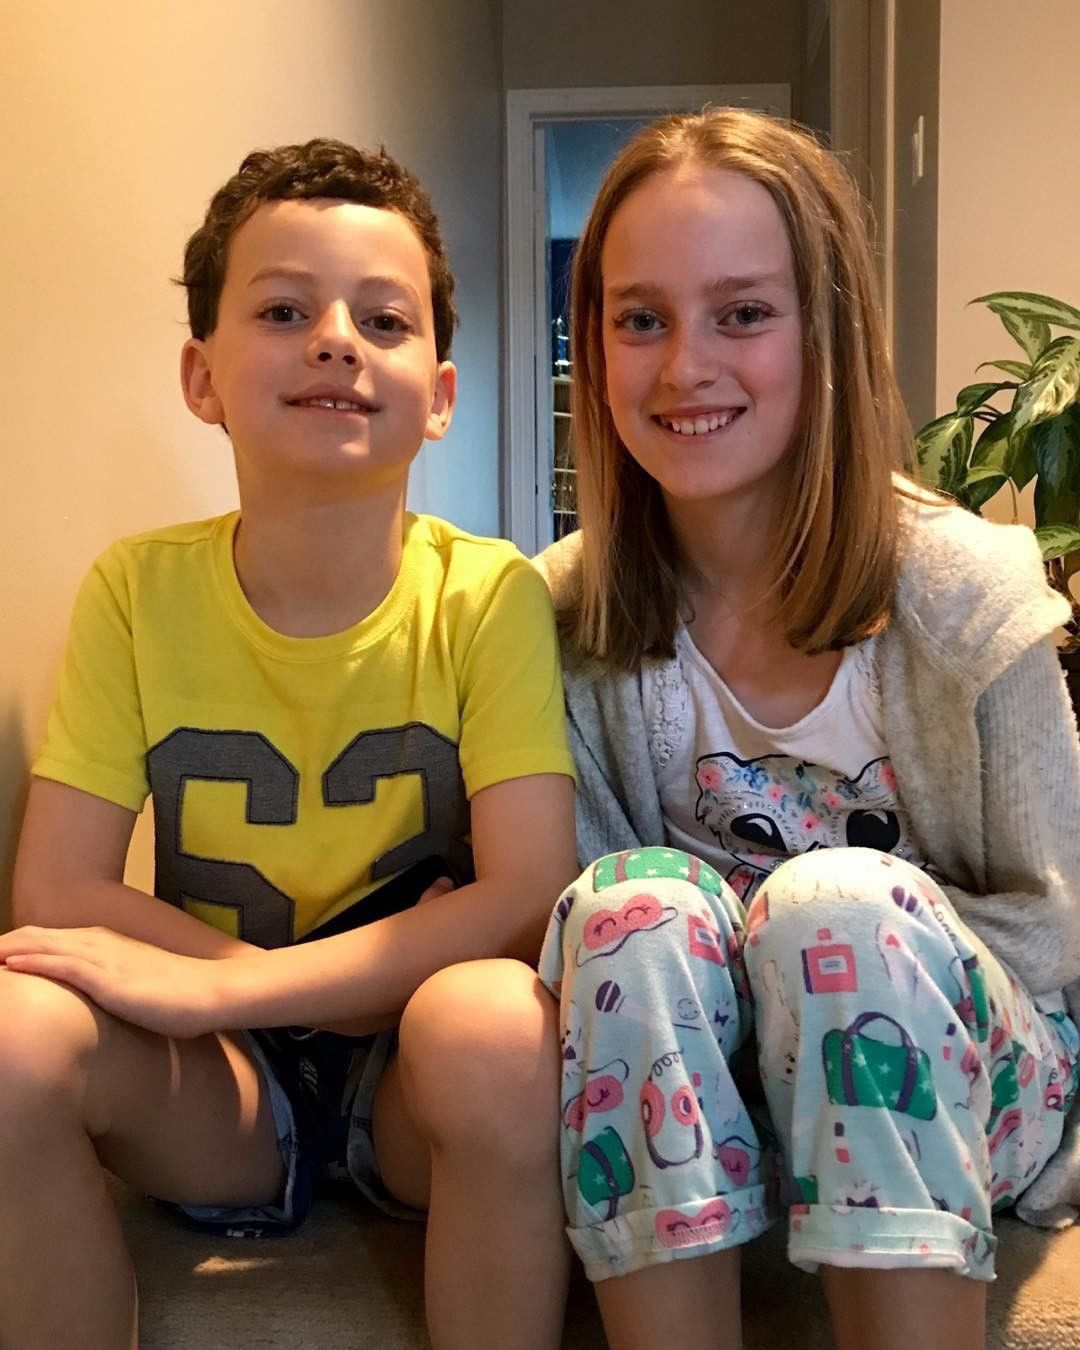
Owen is 9!
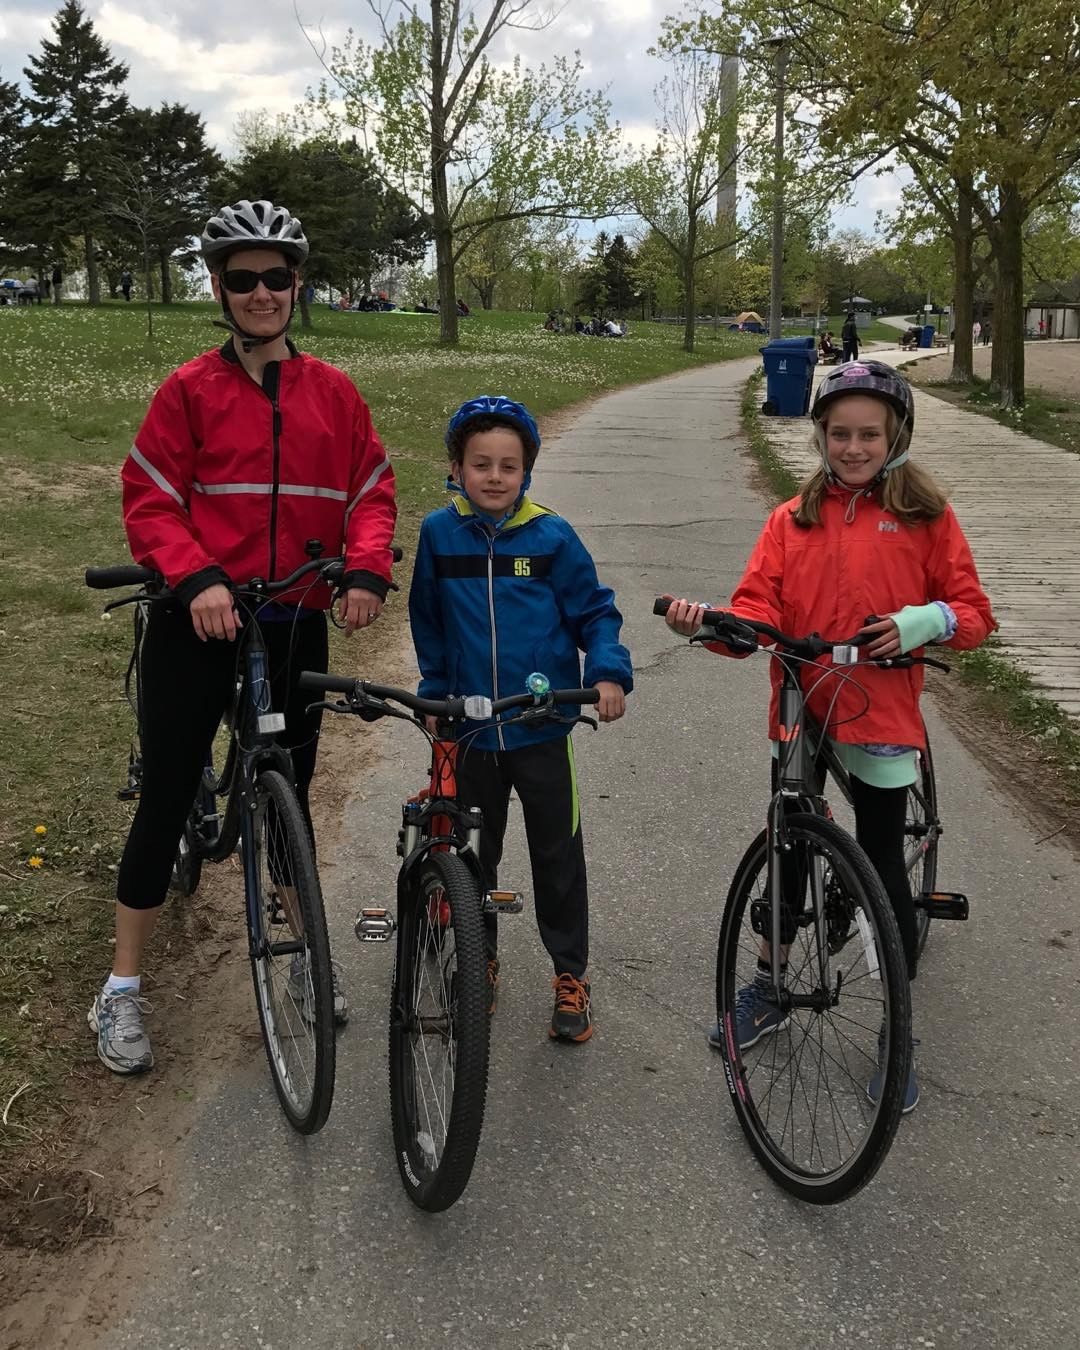
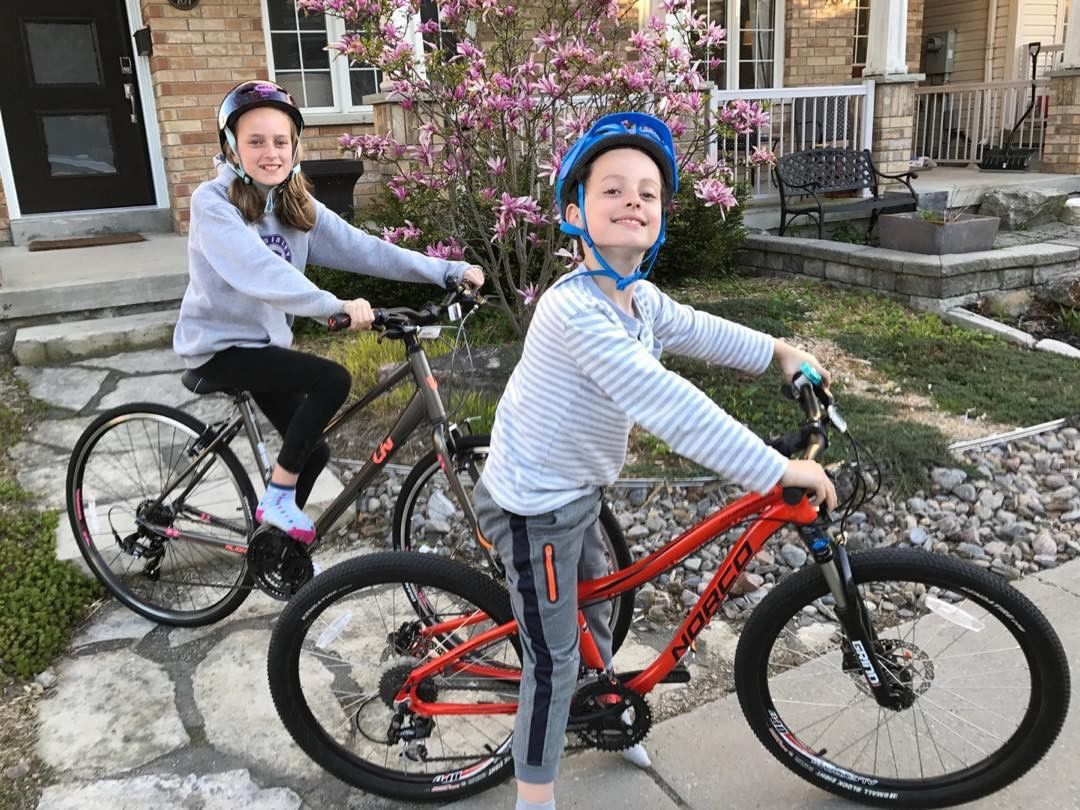
Family bike ride

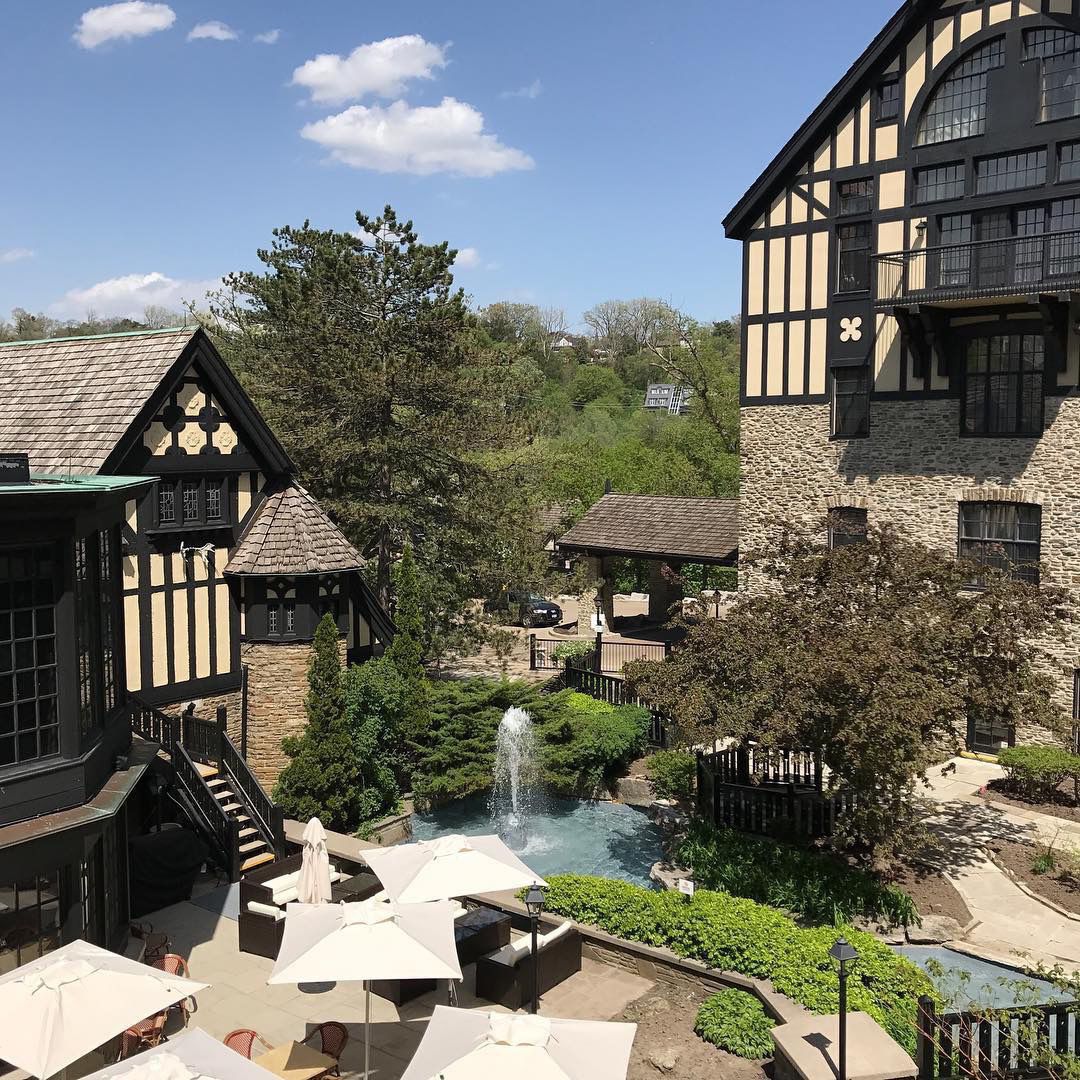
Back at the Old Mill. This time for a conference instead of a wedding.
New bikes
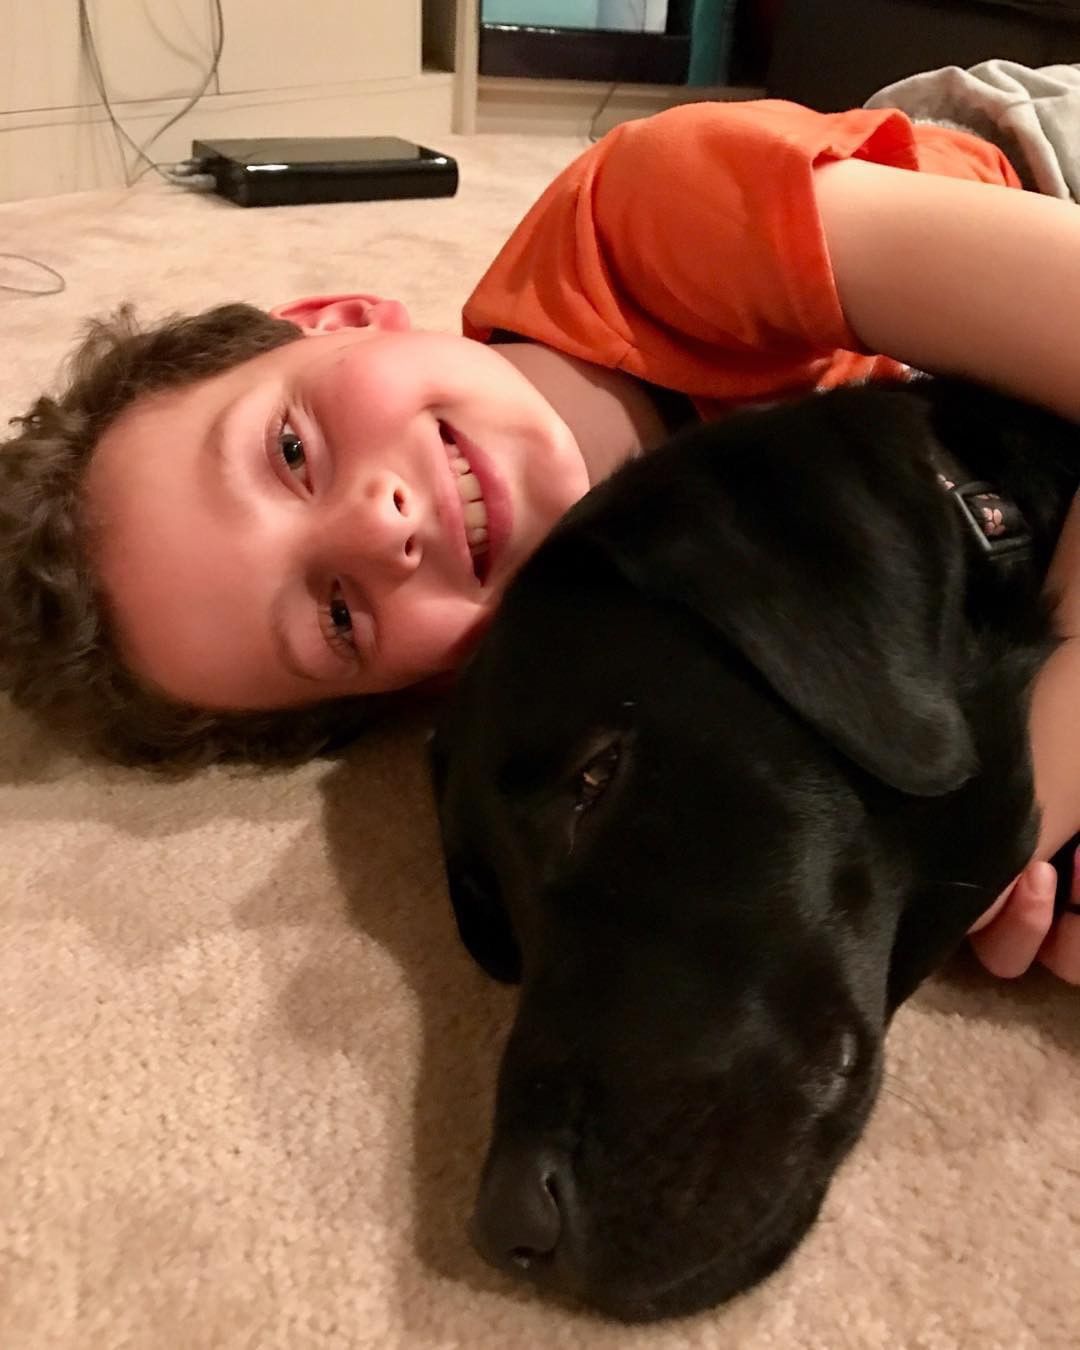
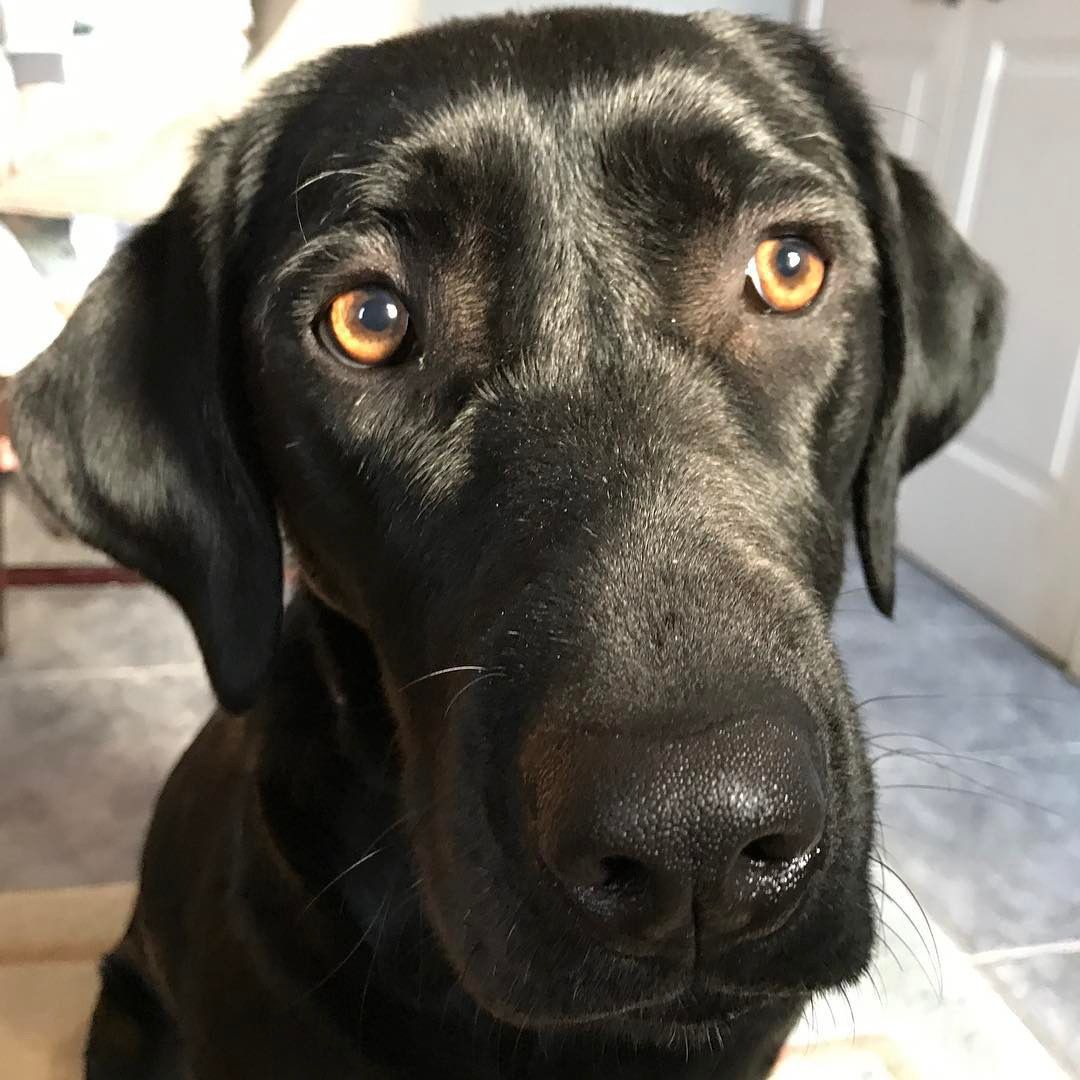
Boy and his dog
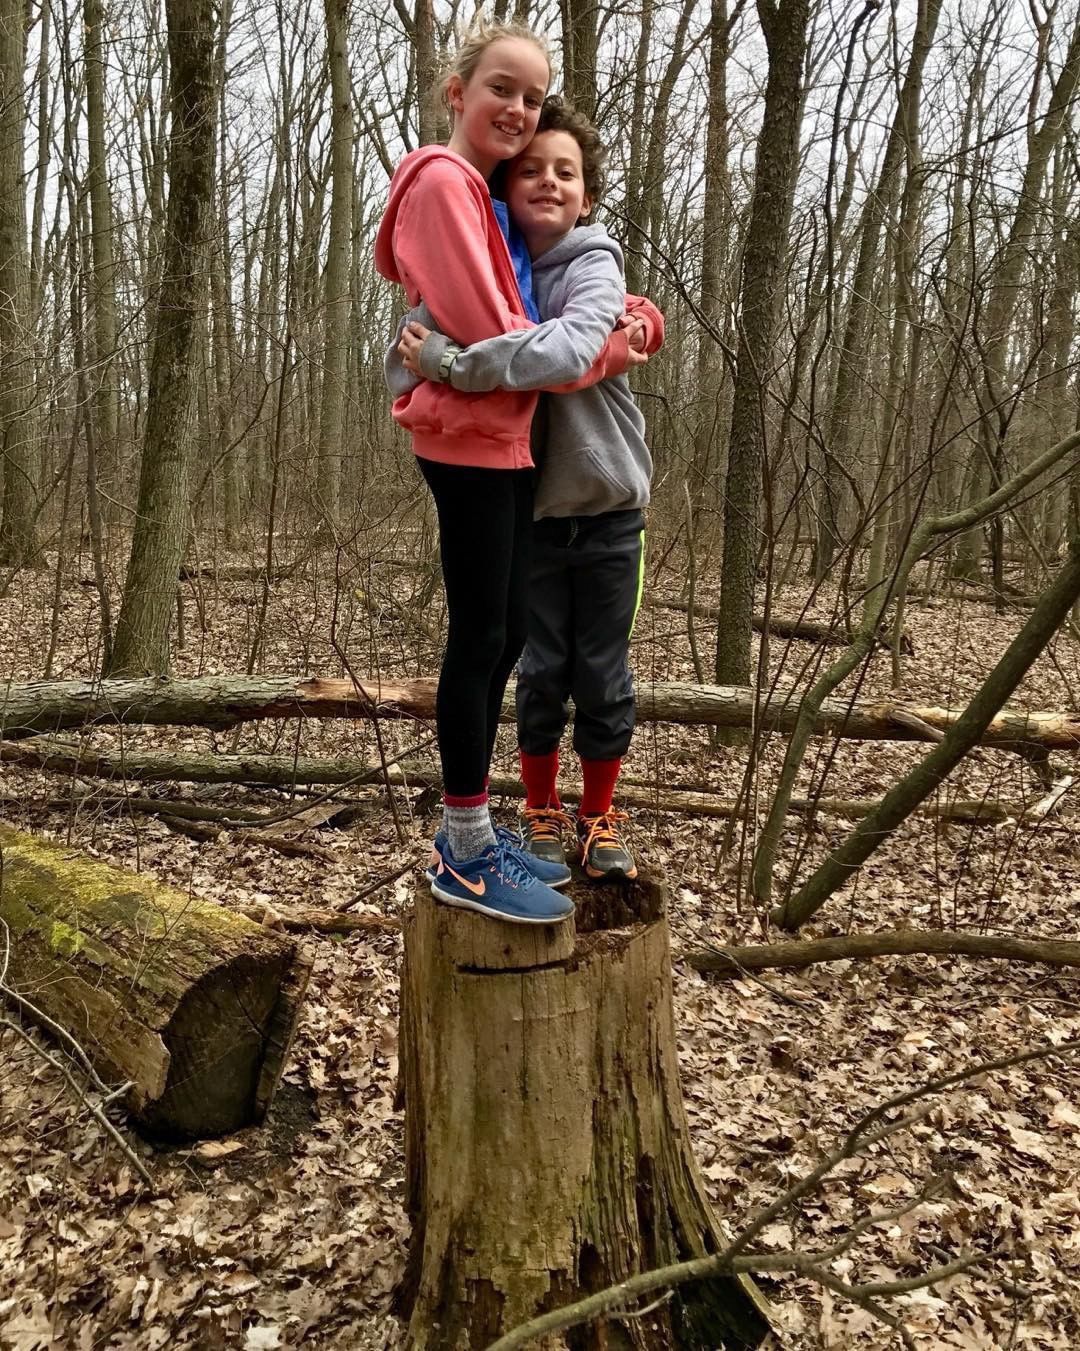
Forest walk
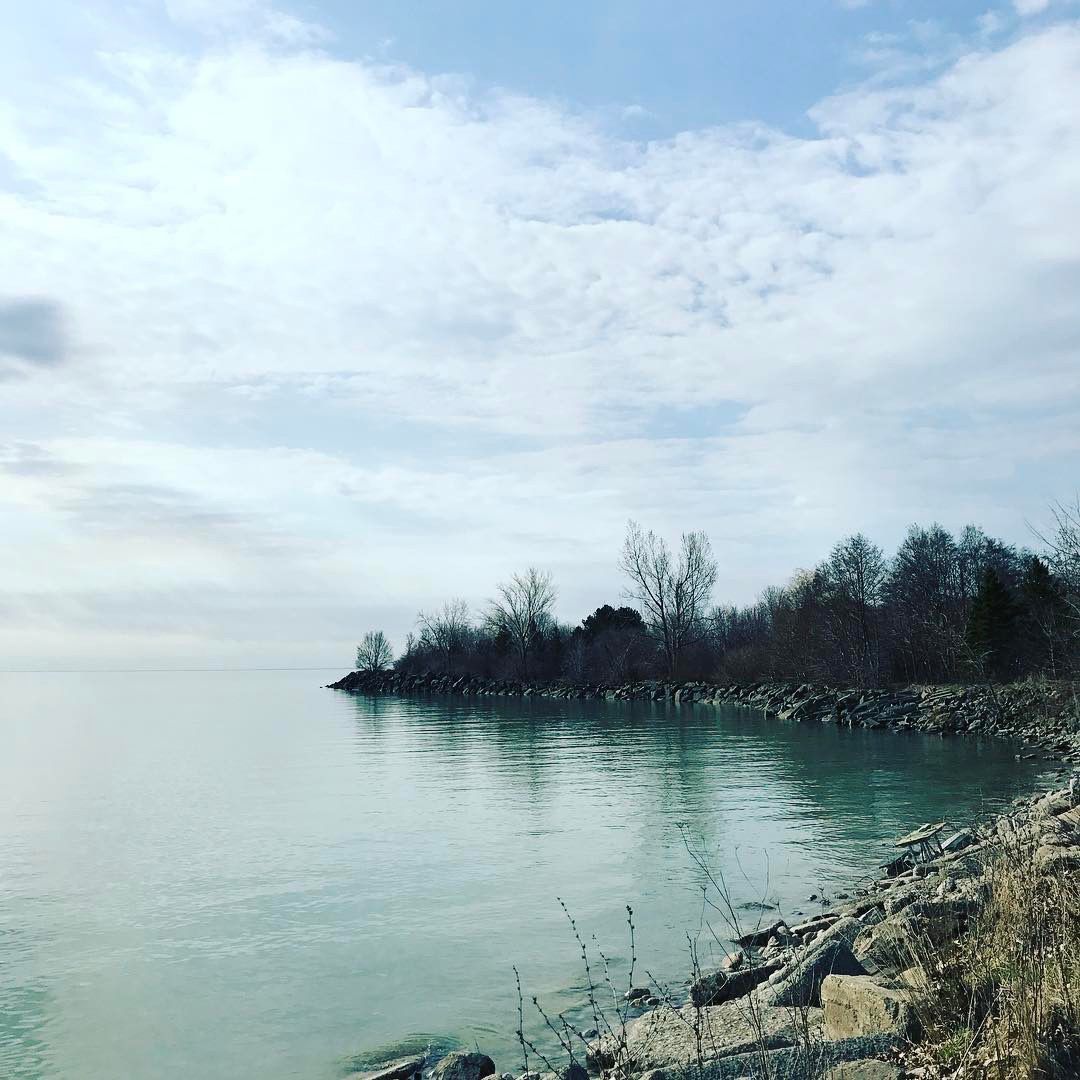
Coming out of hibernation
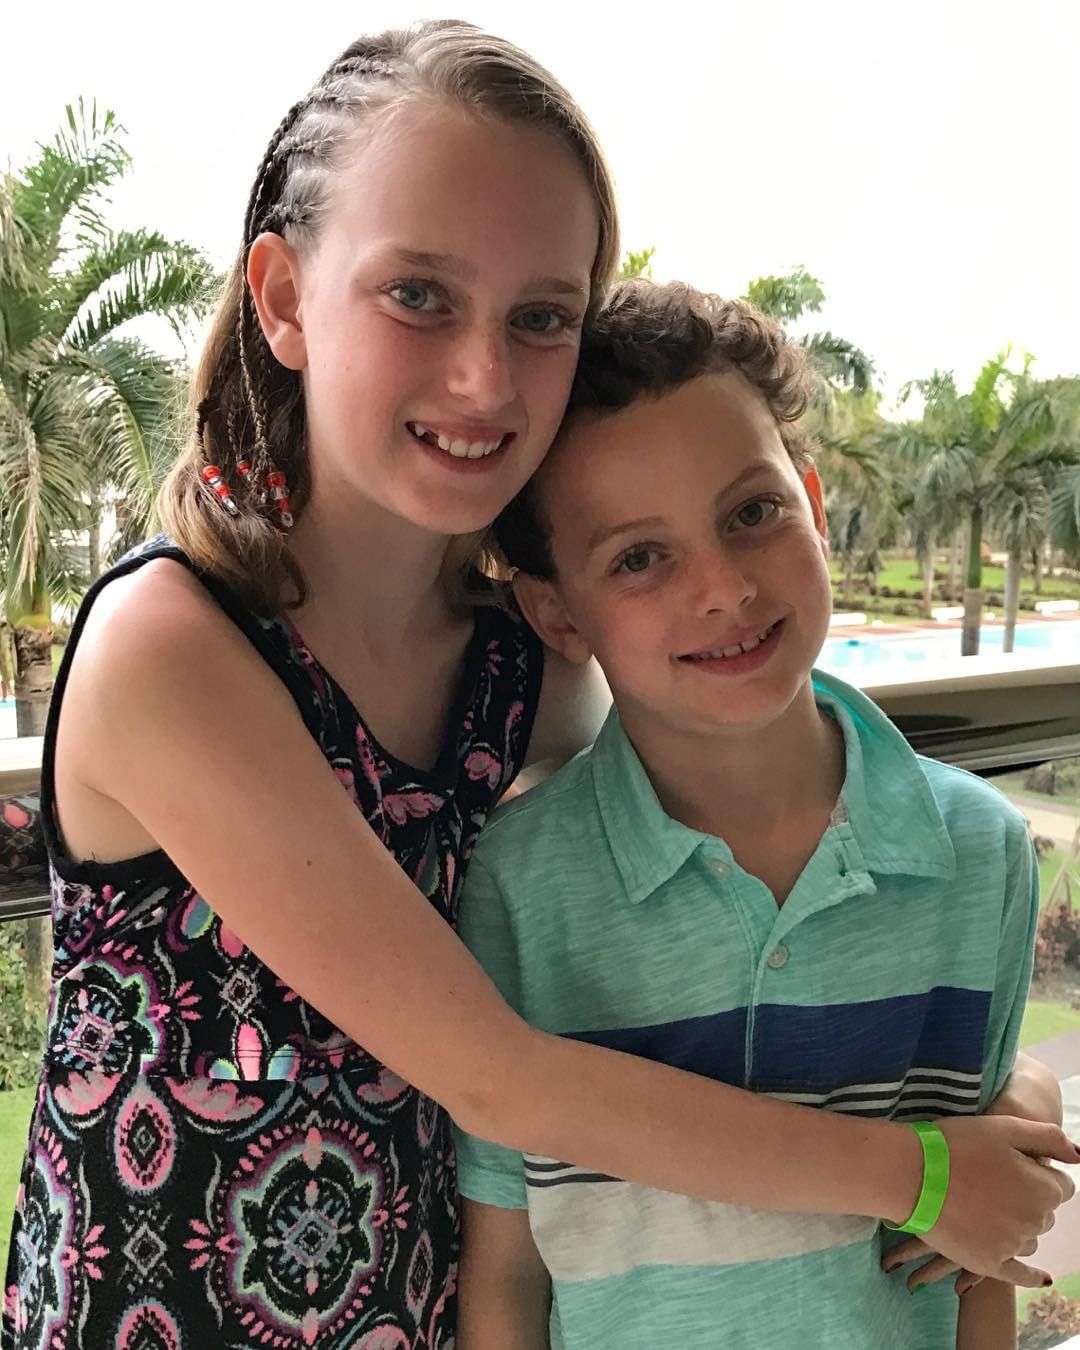
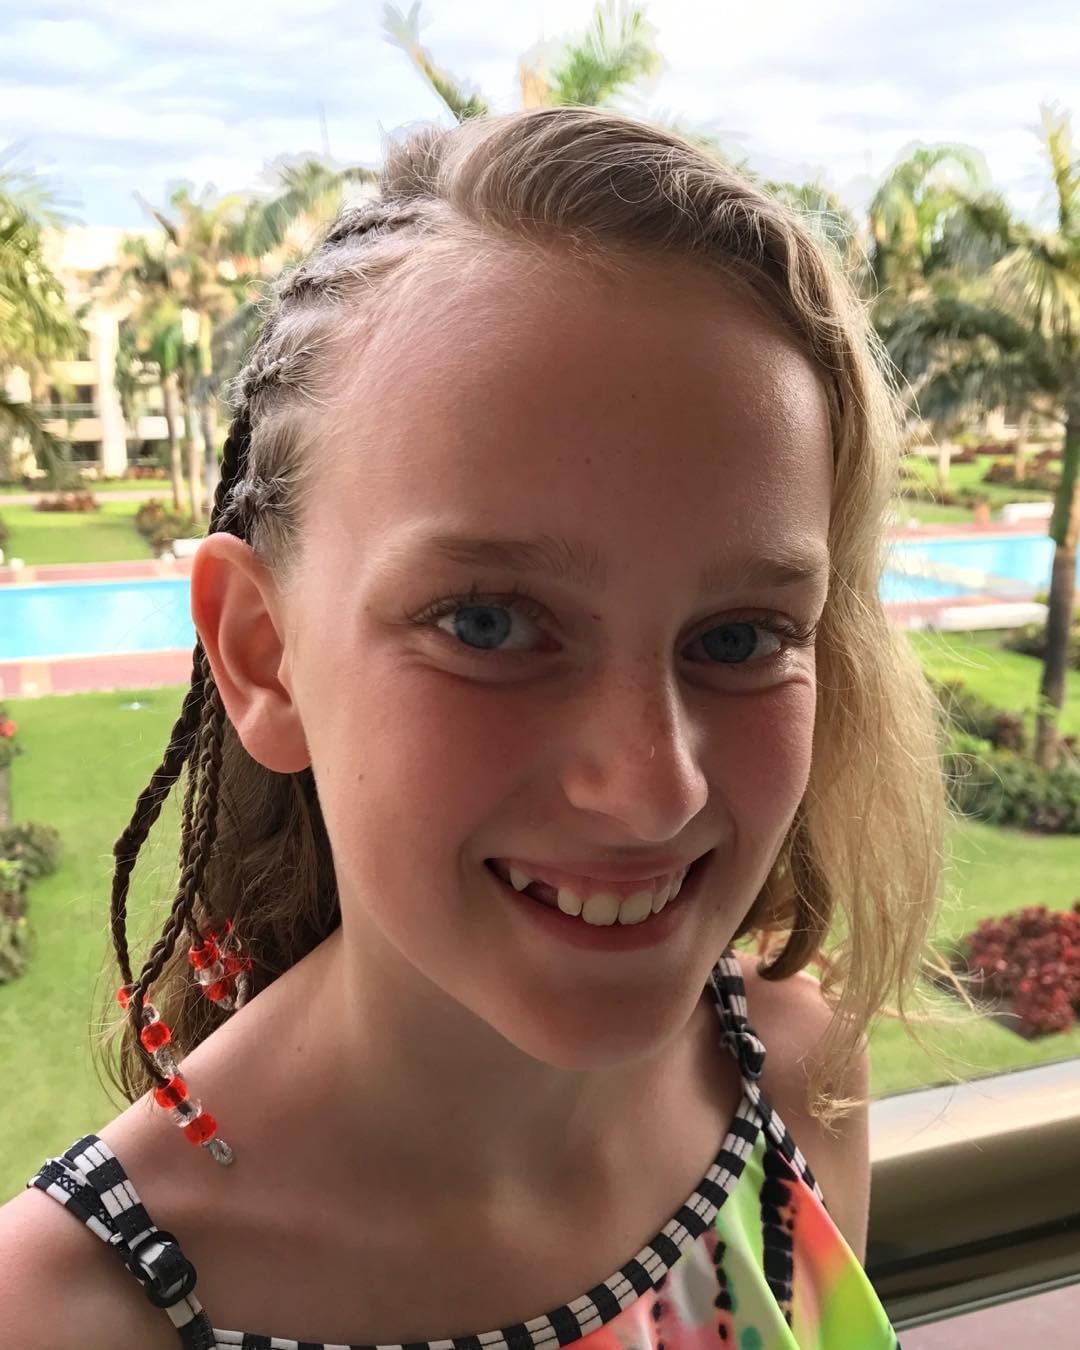
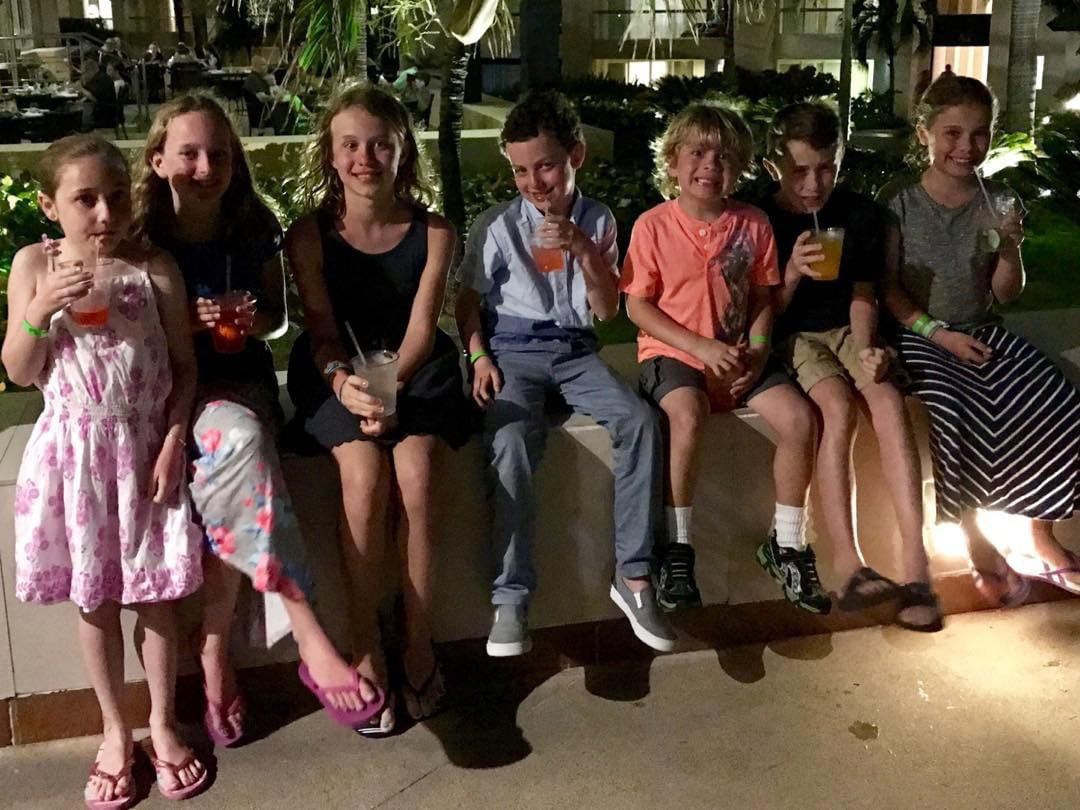
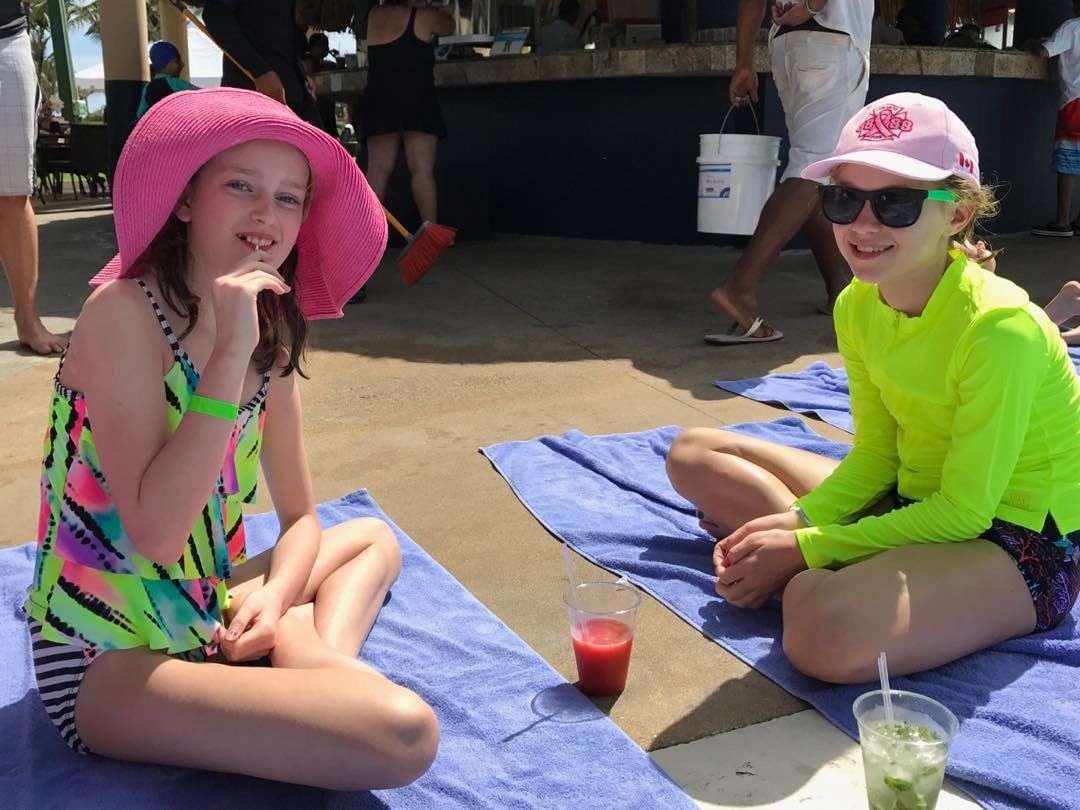
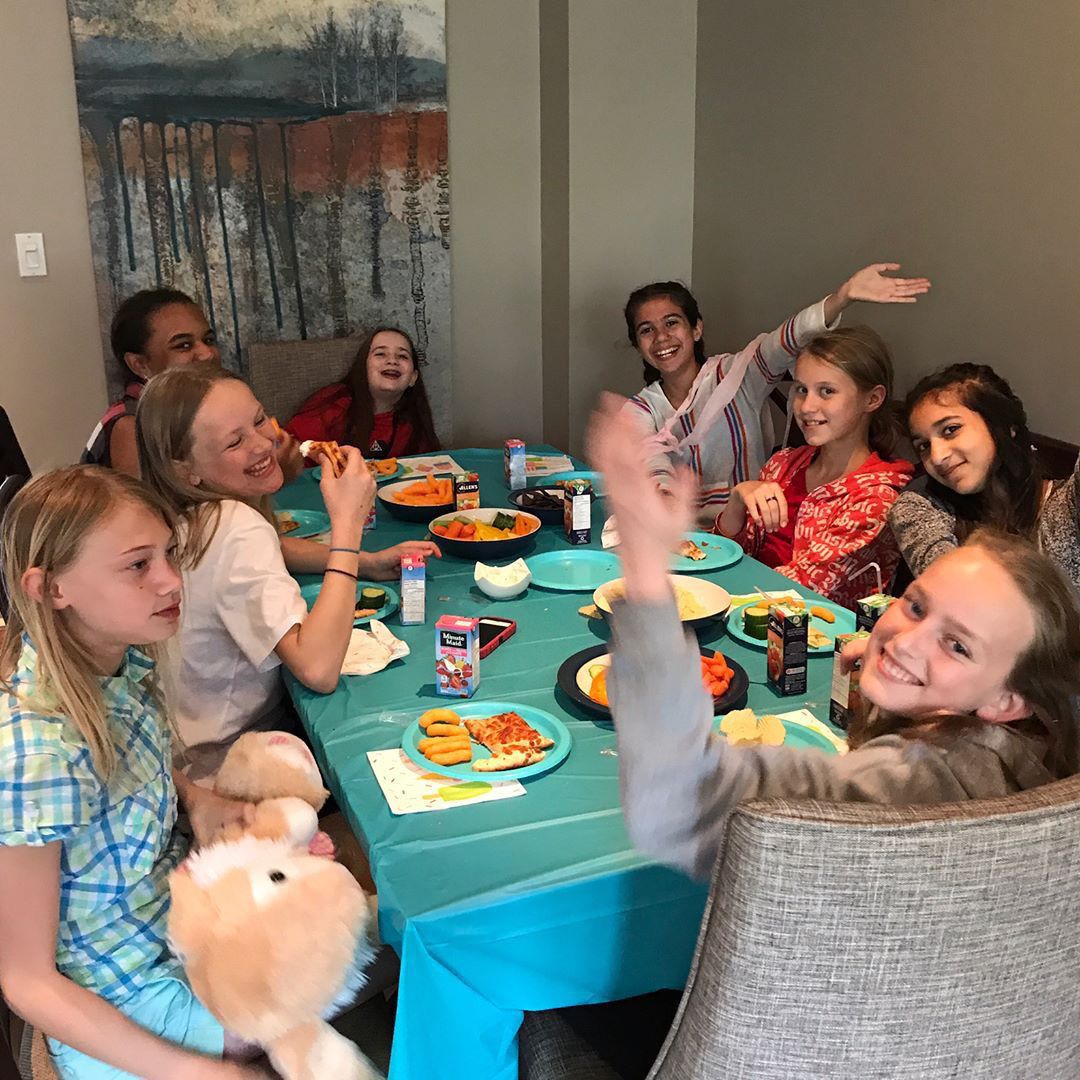
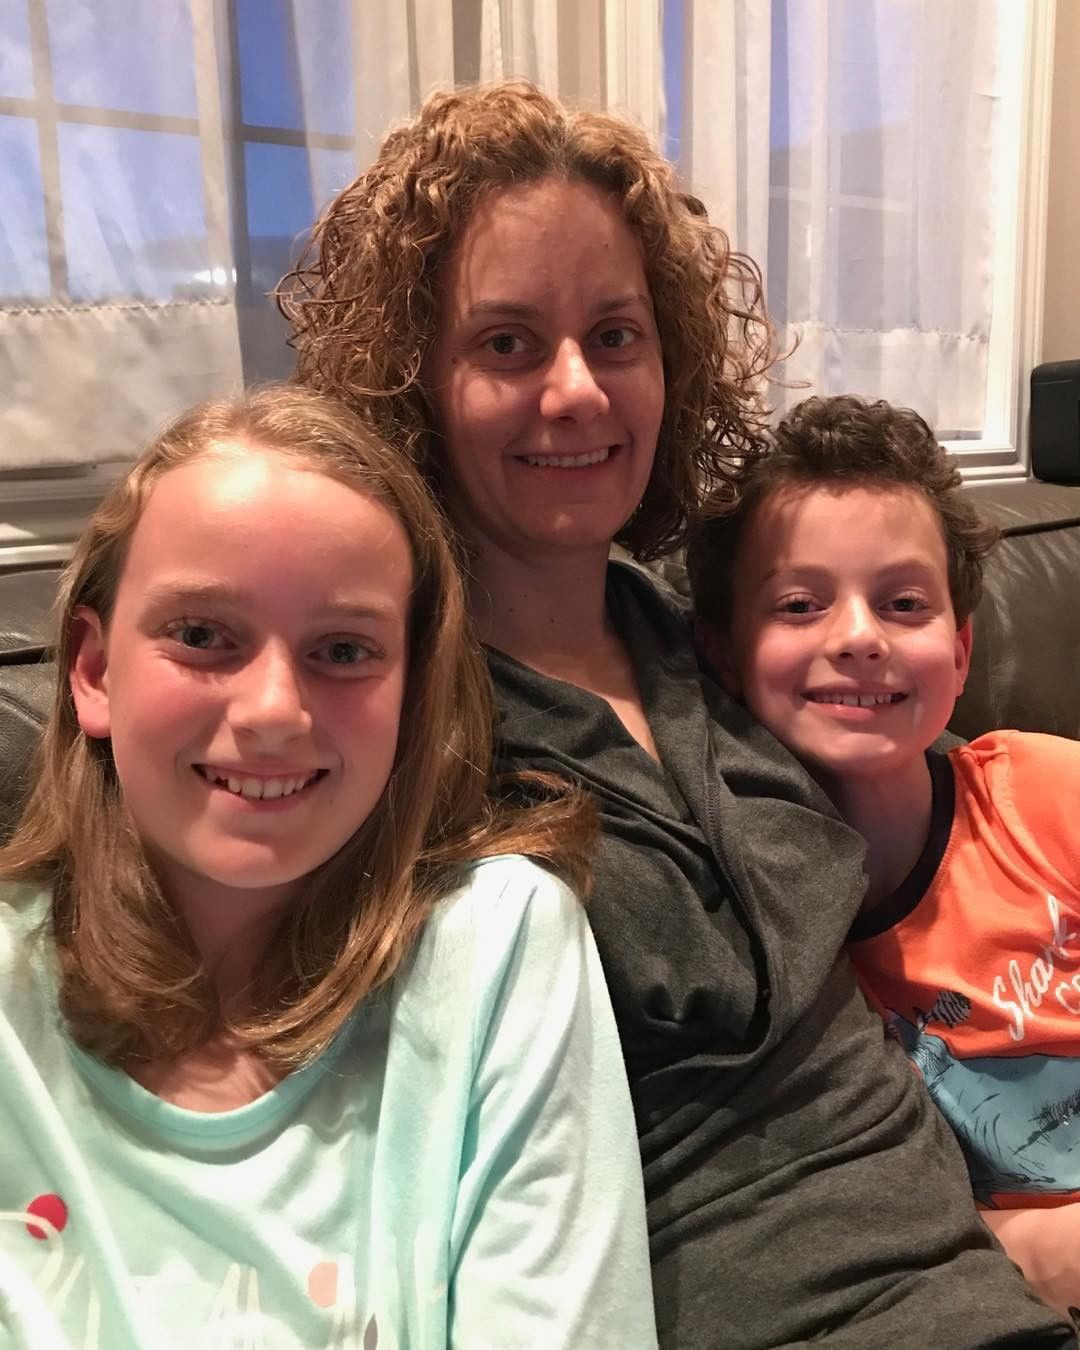
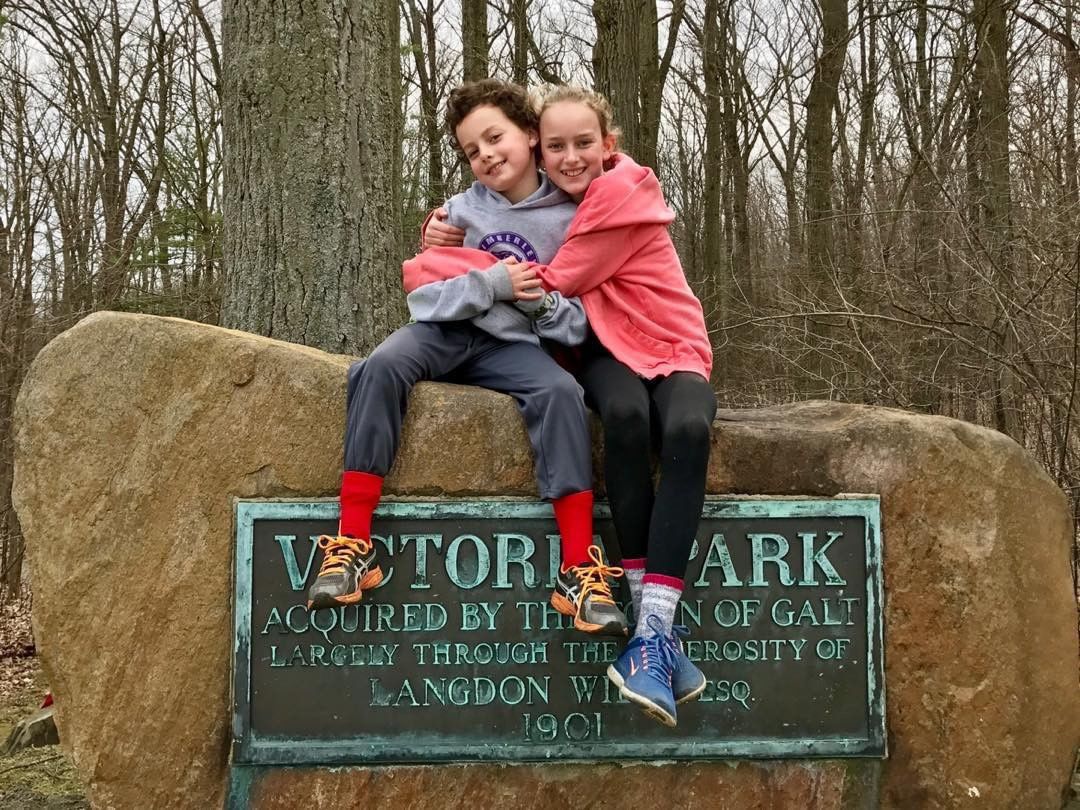
Happy kids