I committed to a 🚴 challenge before checking my results to see if it was reasonable. So, had to conduct some excessive #rstats to see if I was in trouble matt.routleynet.org/post/comm…
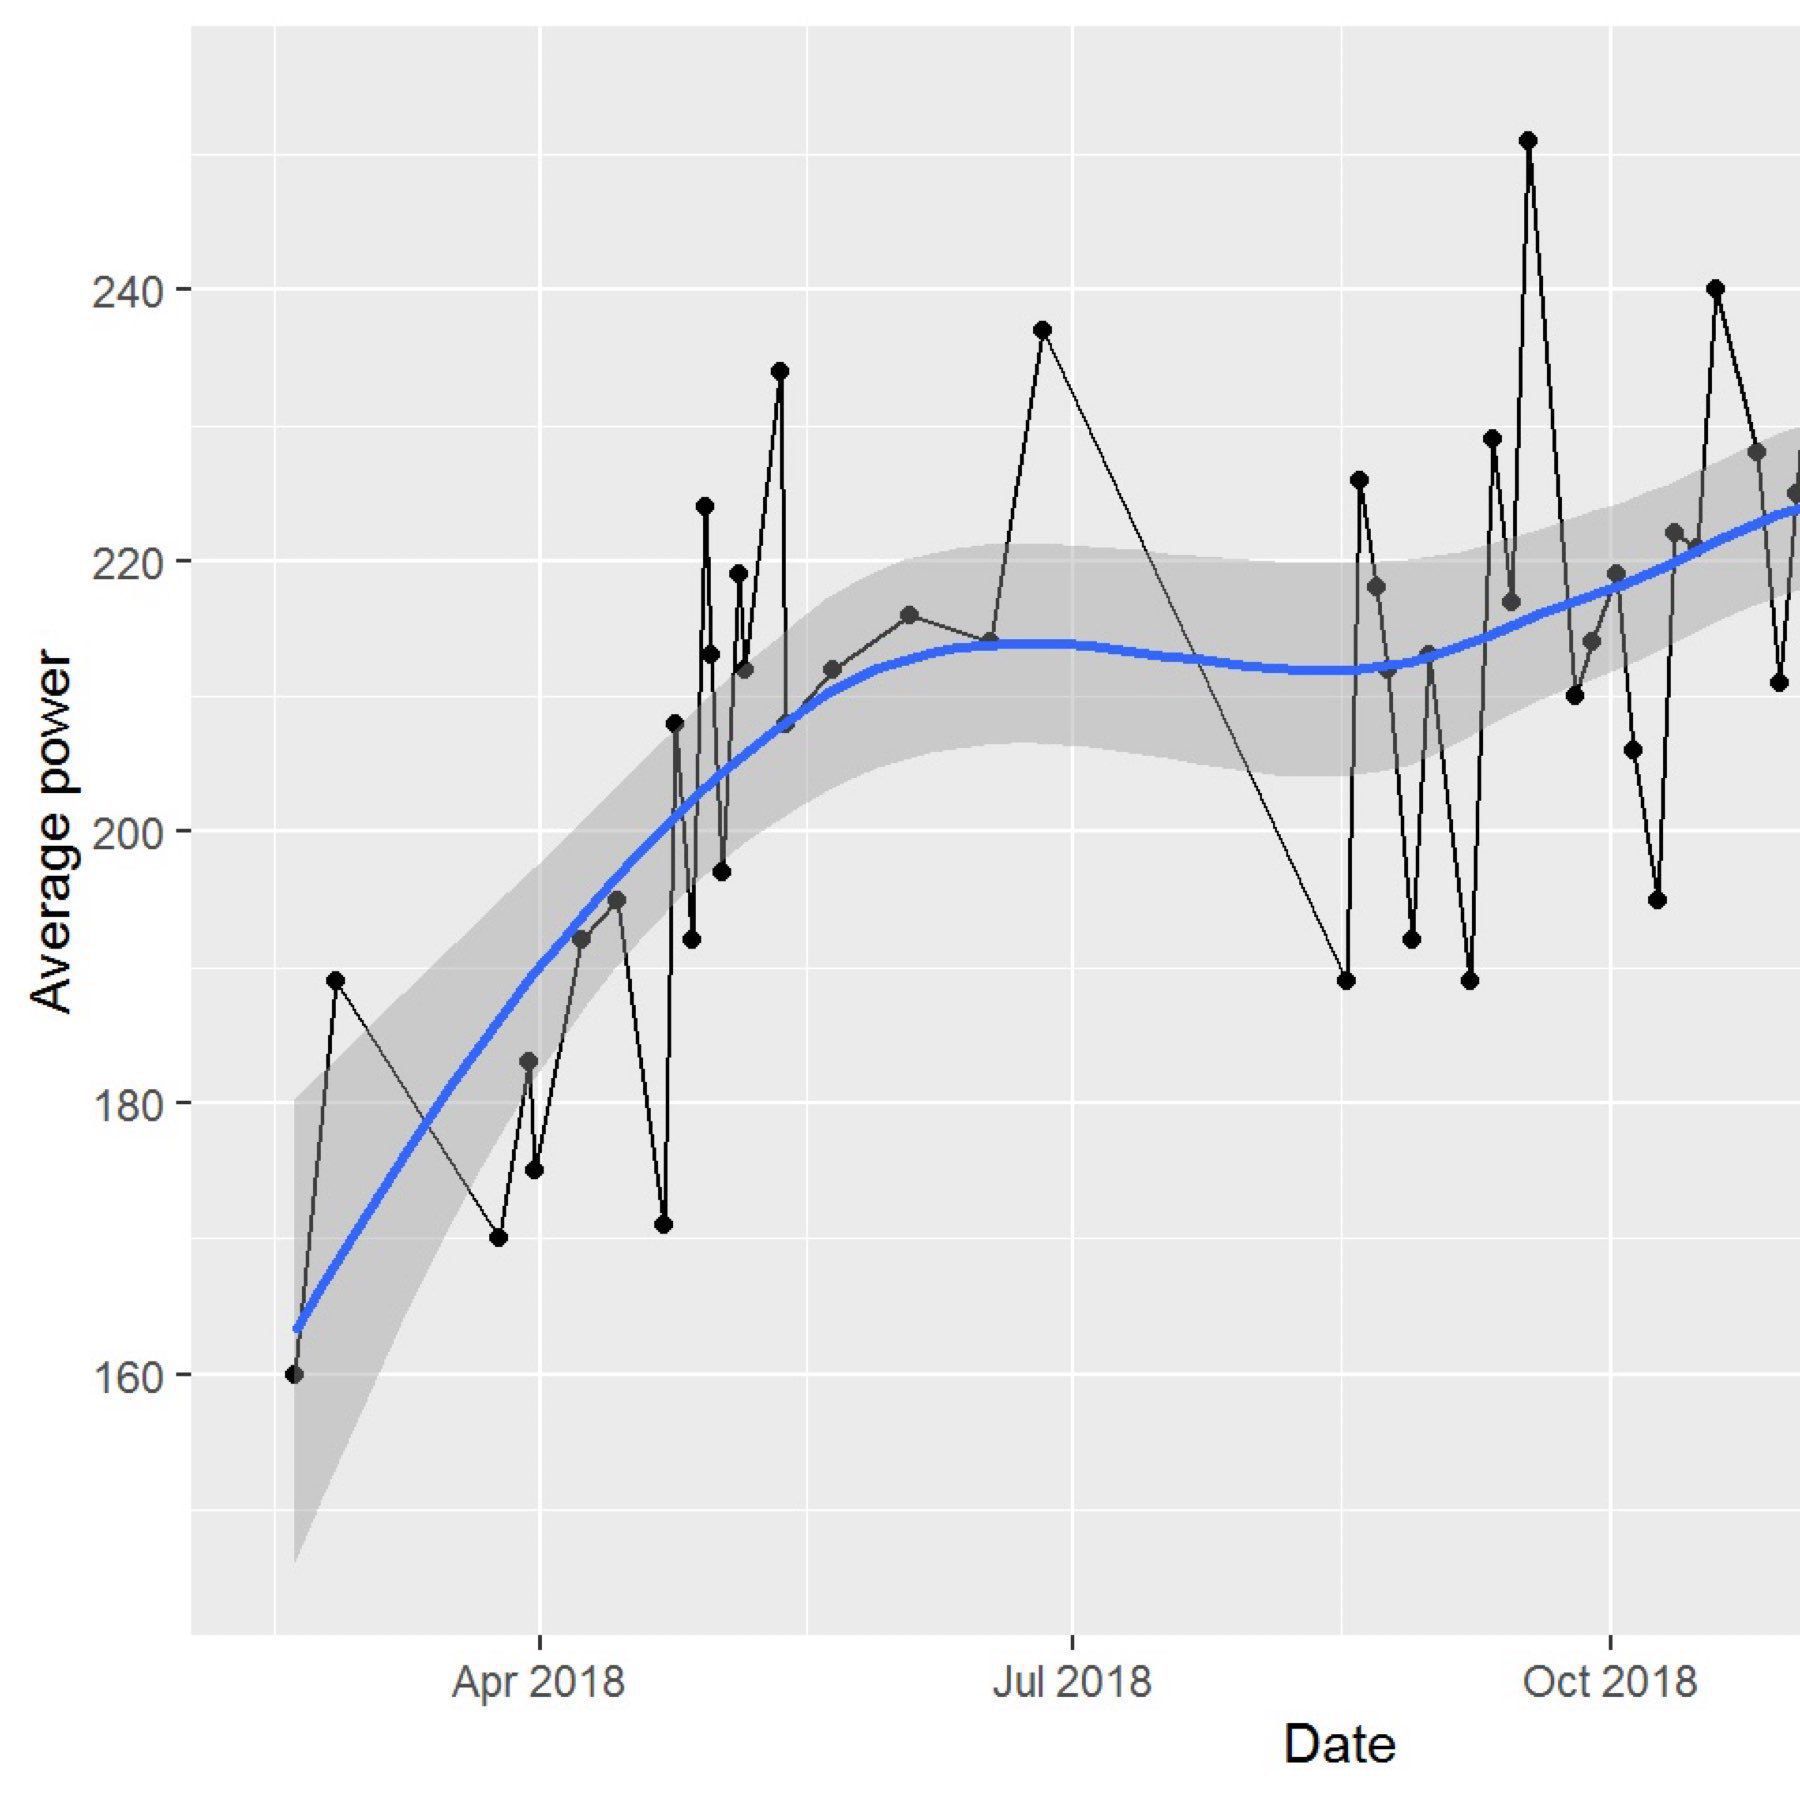
I committed to a 🚴 challenge before checking my results to see if it was reasonable. So, had to conduct some excessive #rstats to see if I was in trouble matt.routleynet.org/post/comm…
My favourite spin studio has put on a fitness challenge for 2019. It has many components, one of which is improving your performance by 3% over six weeks. I’ve taken on the challenge and am now worried that I don’t know how reasonable this increase actually is. So, a perfect excuse to extract my metrics and perform some excessive analysis. We start by importing a CSV file of my stats, taken from Torq’s website.
After just two episodes, I’m definitely enjoying season 2 of Star Trek Discovery more than season 1. There were good parts of season 1, but overall it didn’t hold together for me. Regardless, always great to have new Star Trek
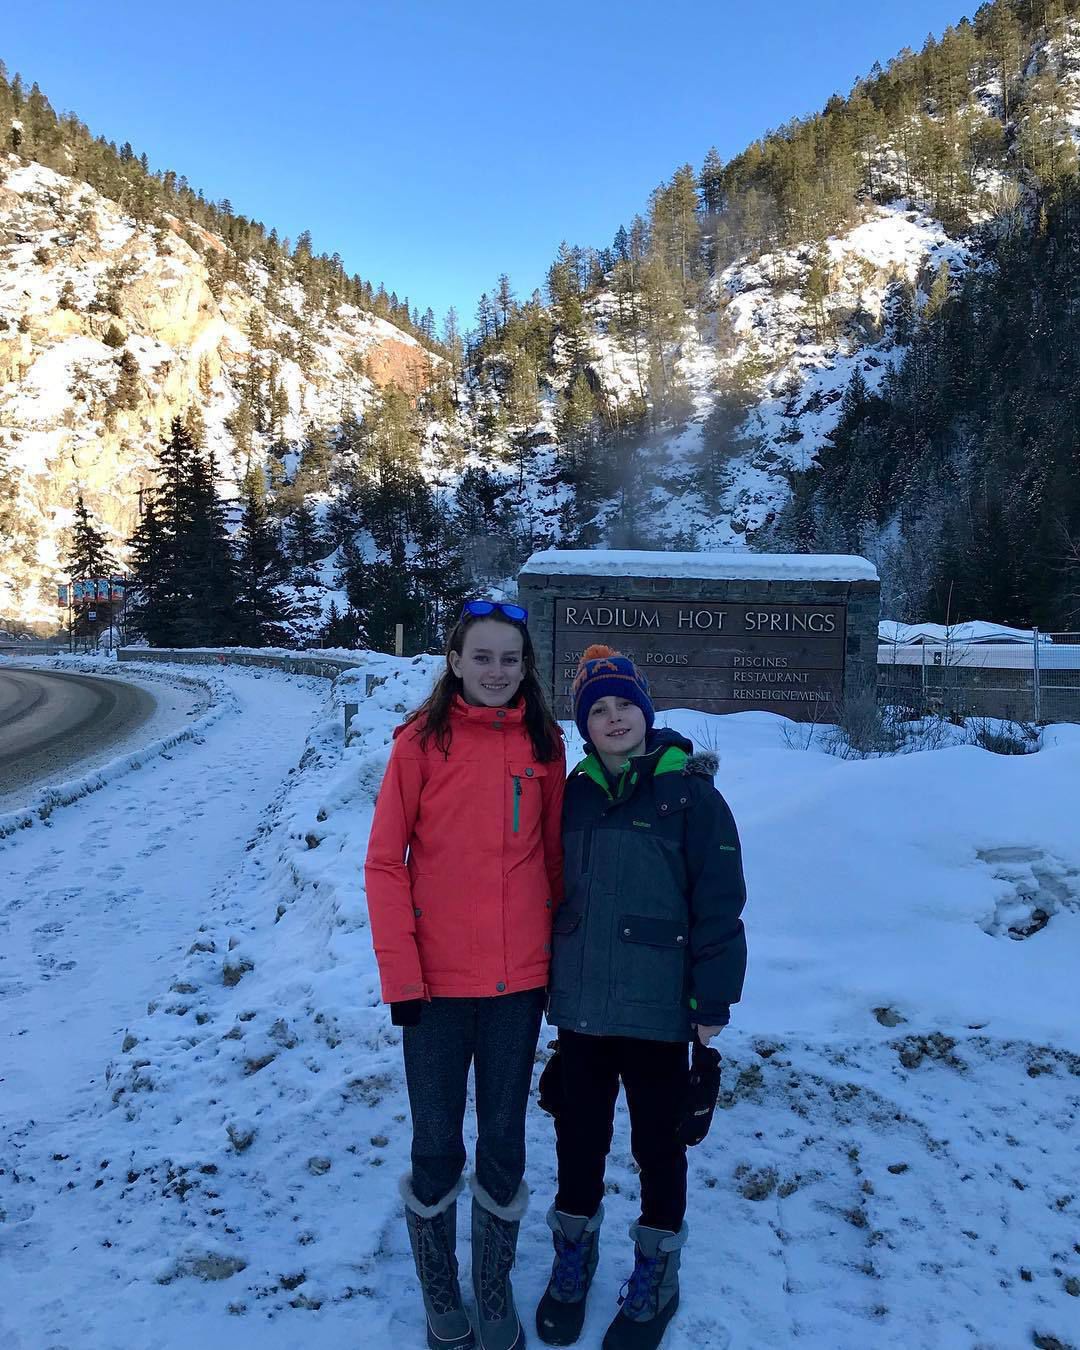
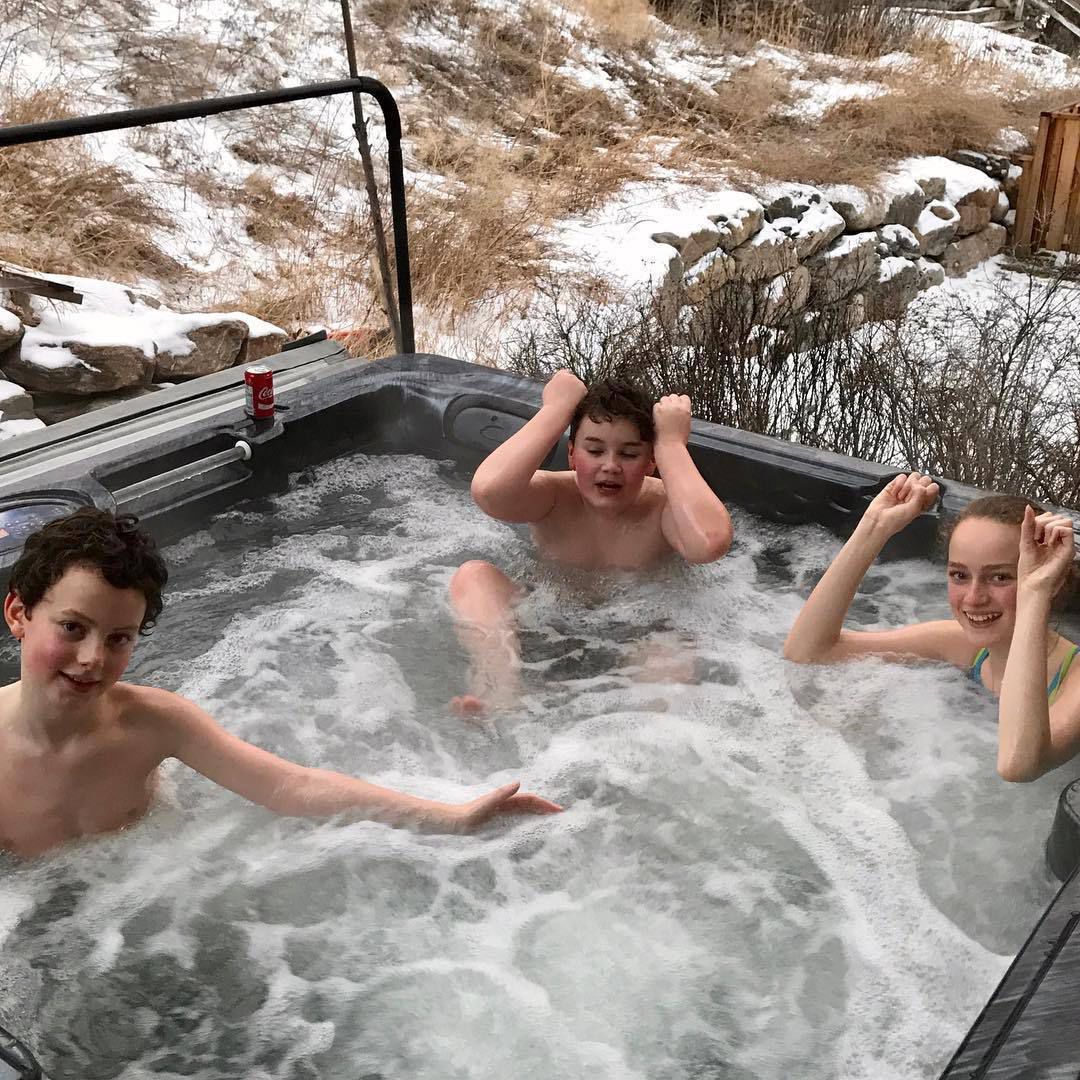
After four great ski days, we rested our legs in the hot springs today
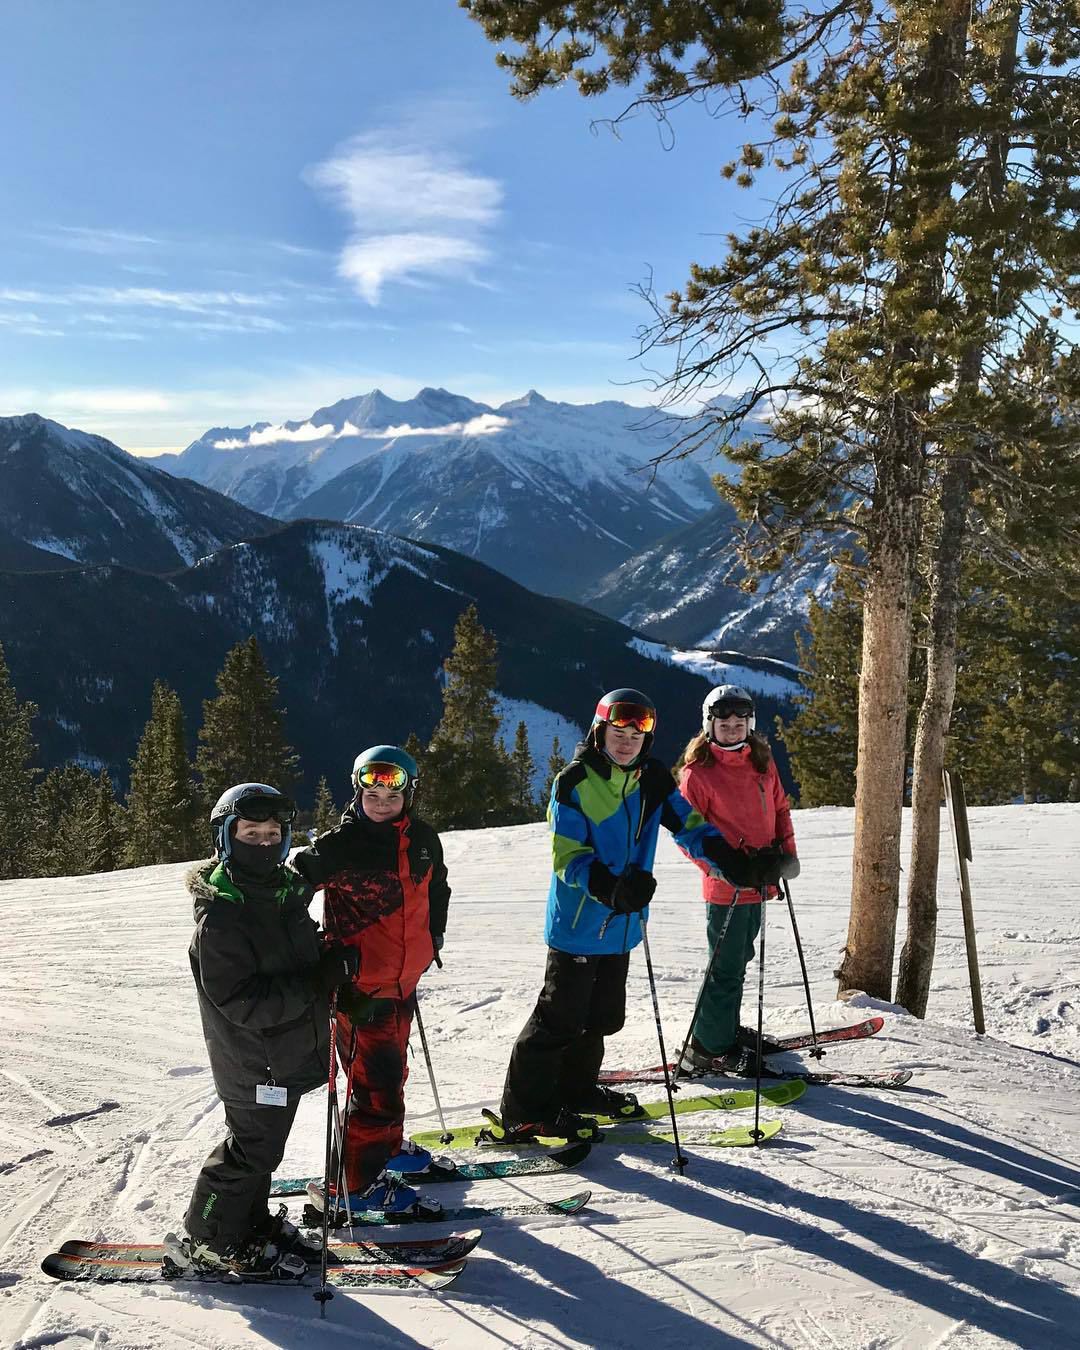
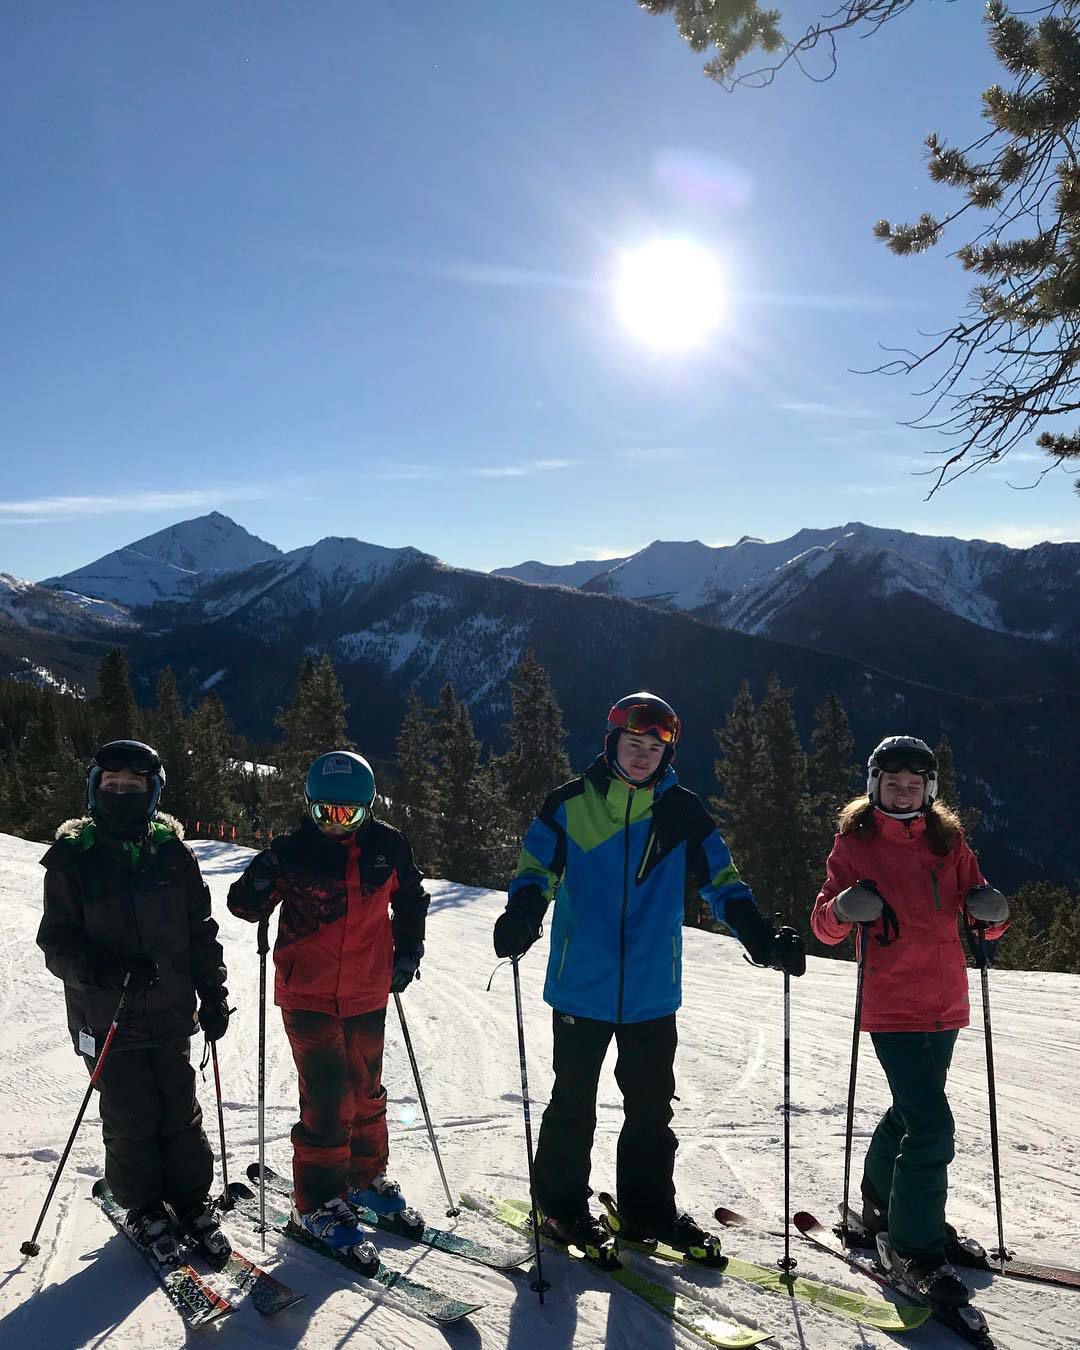
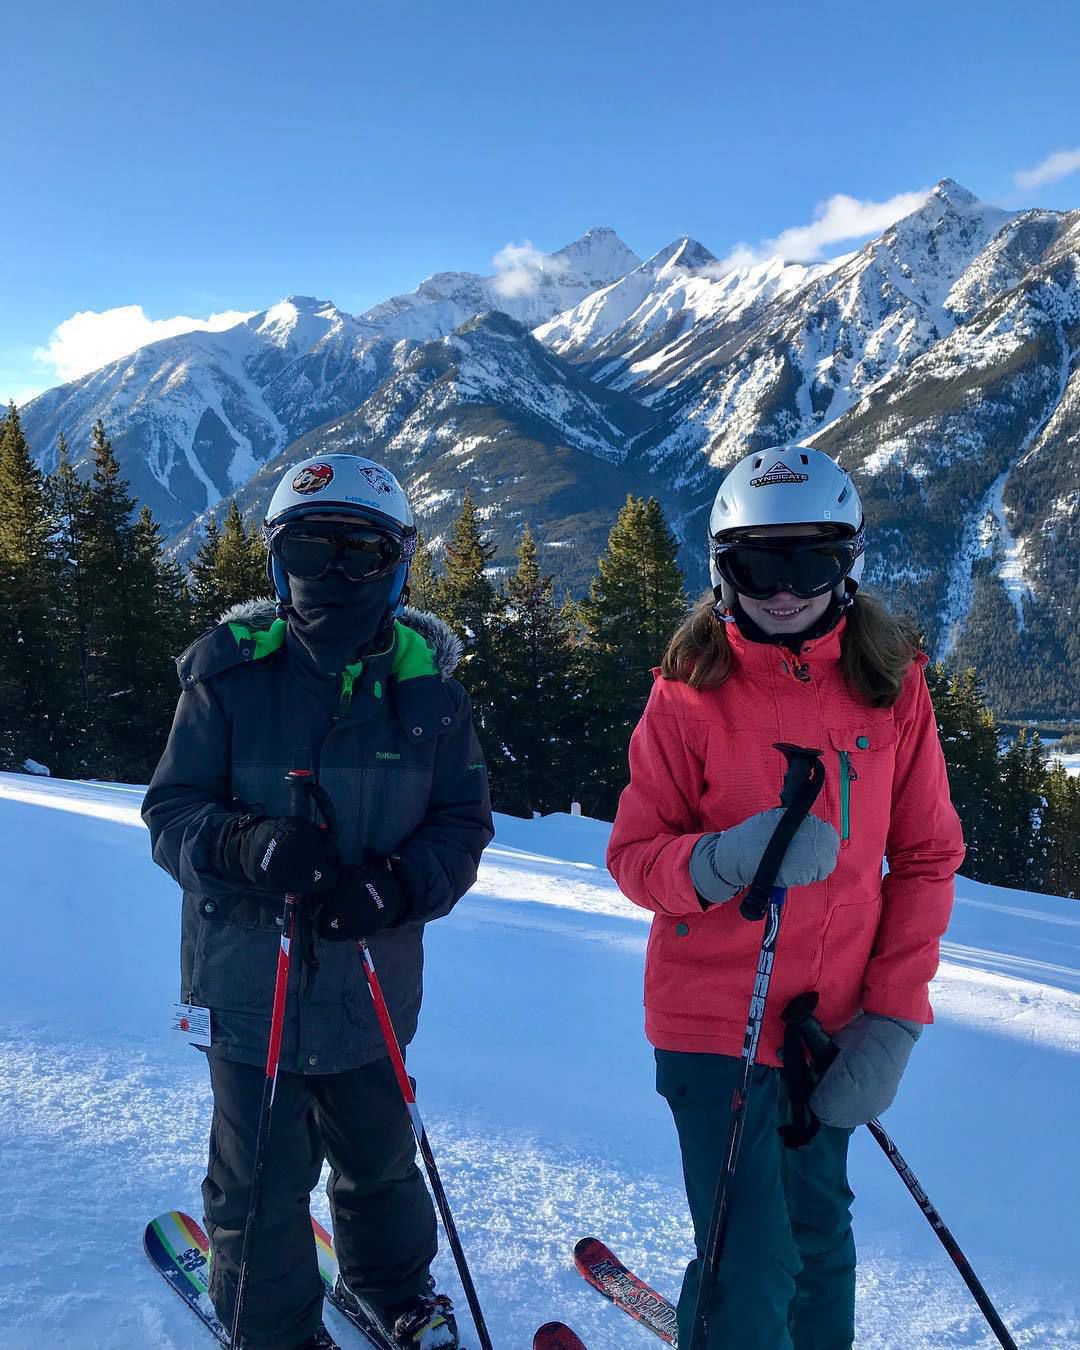

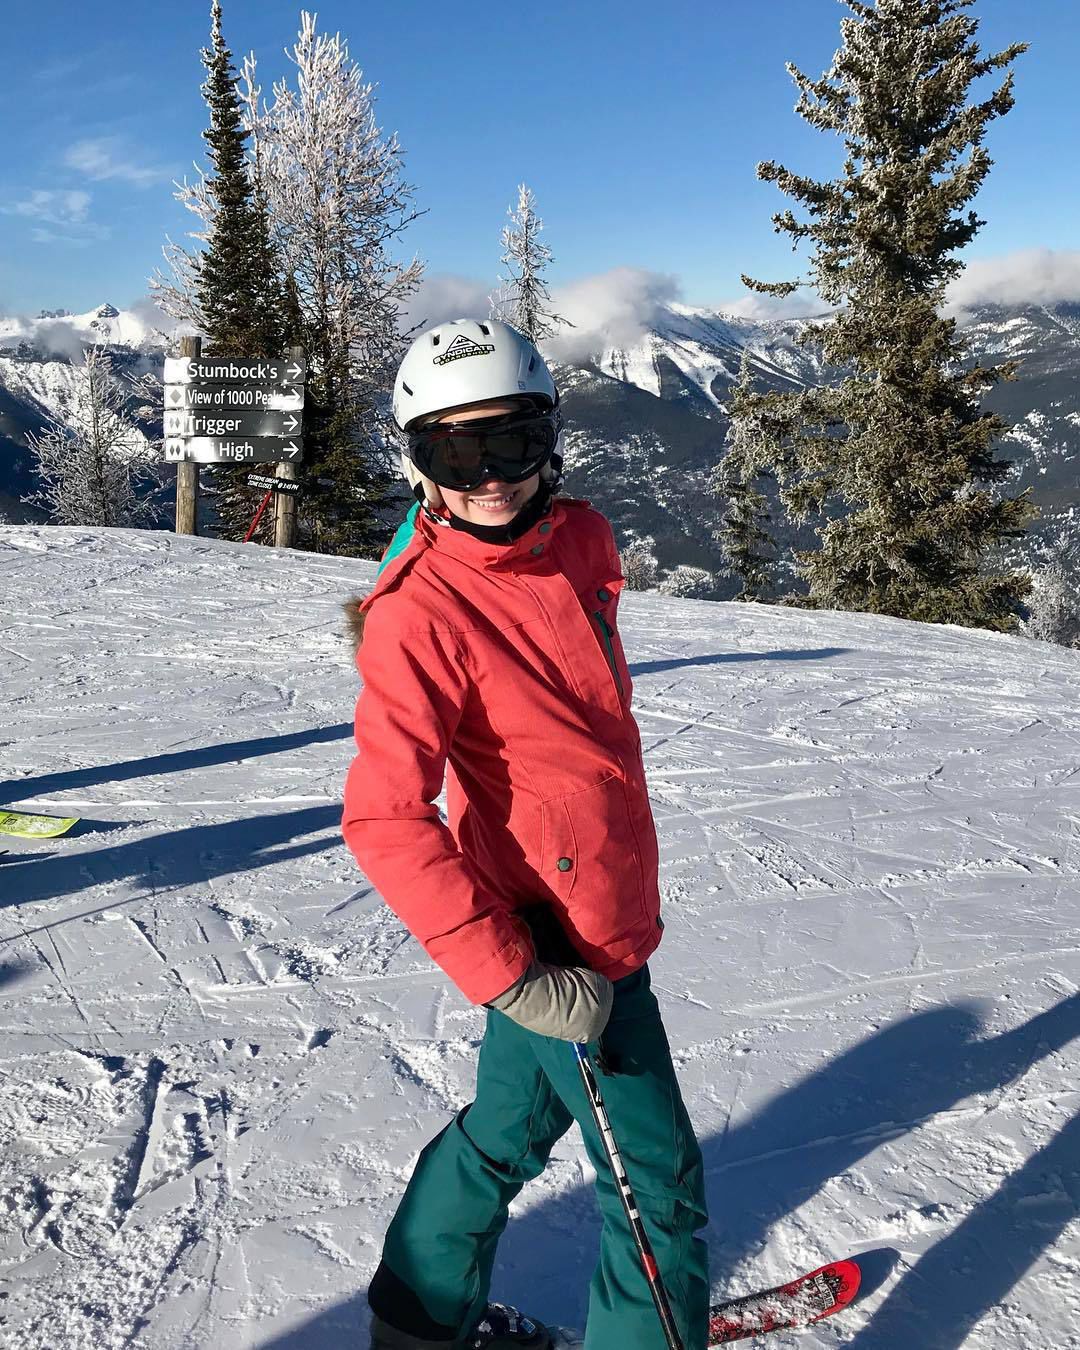
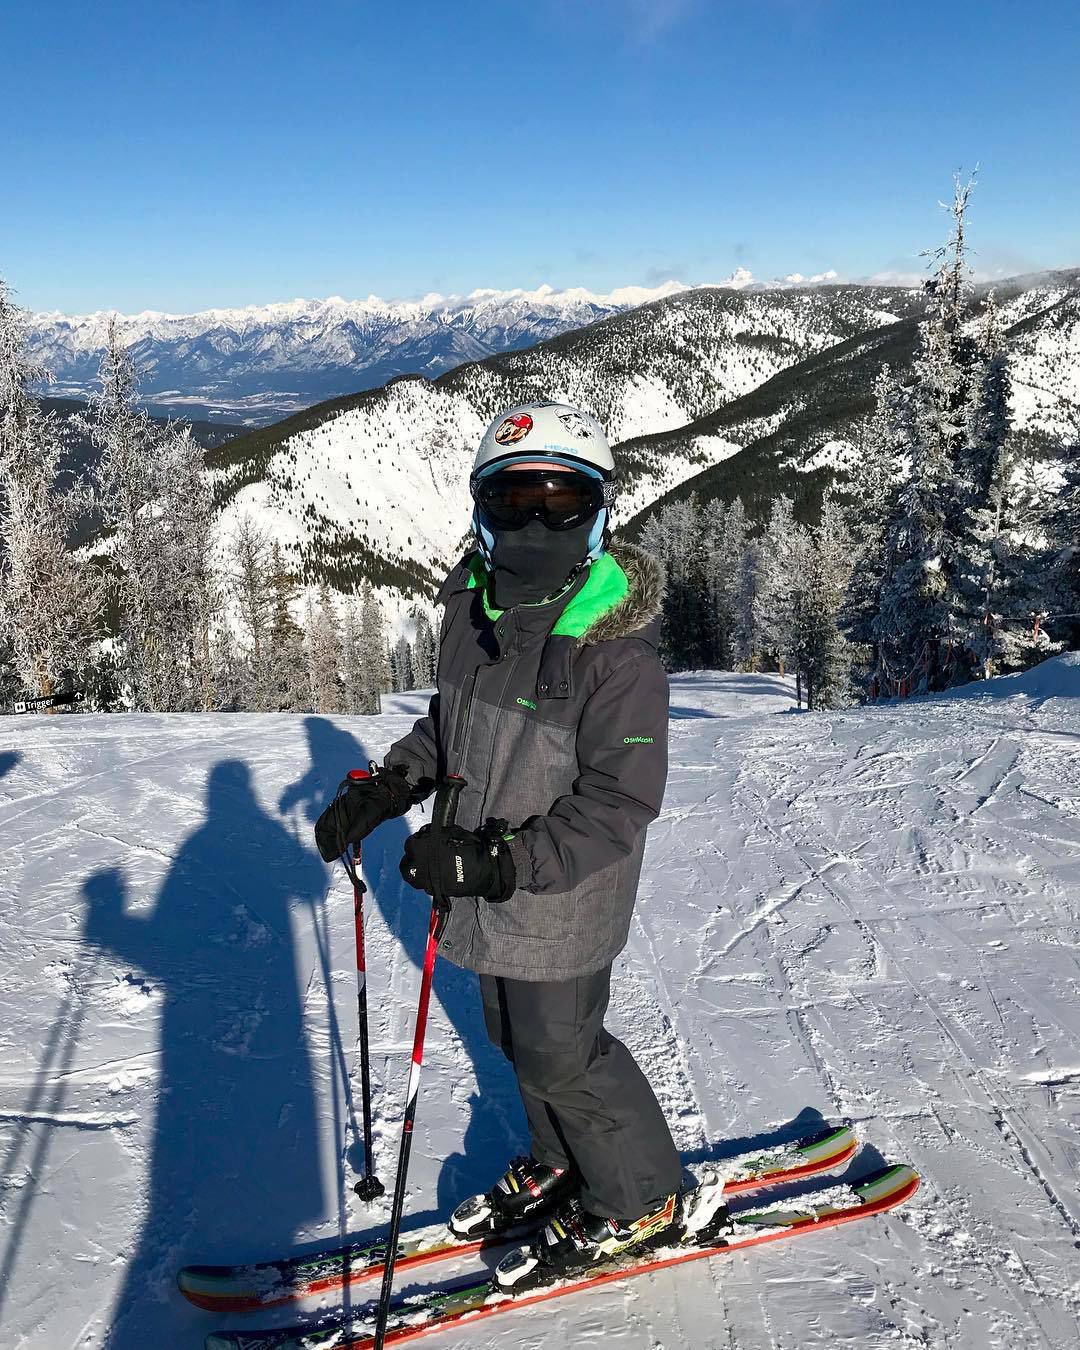
Another great ski day
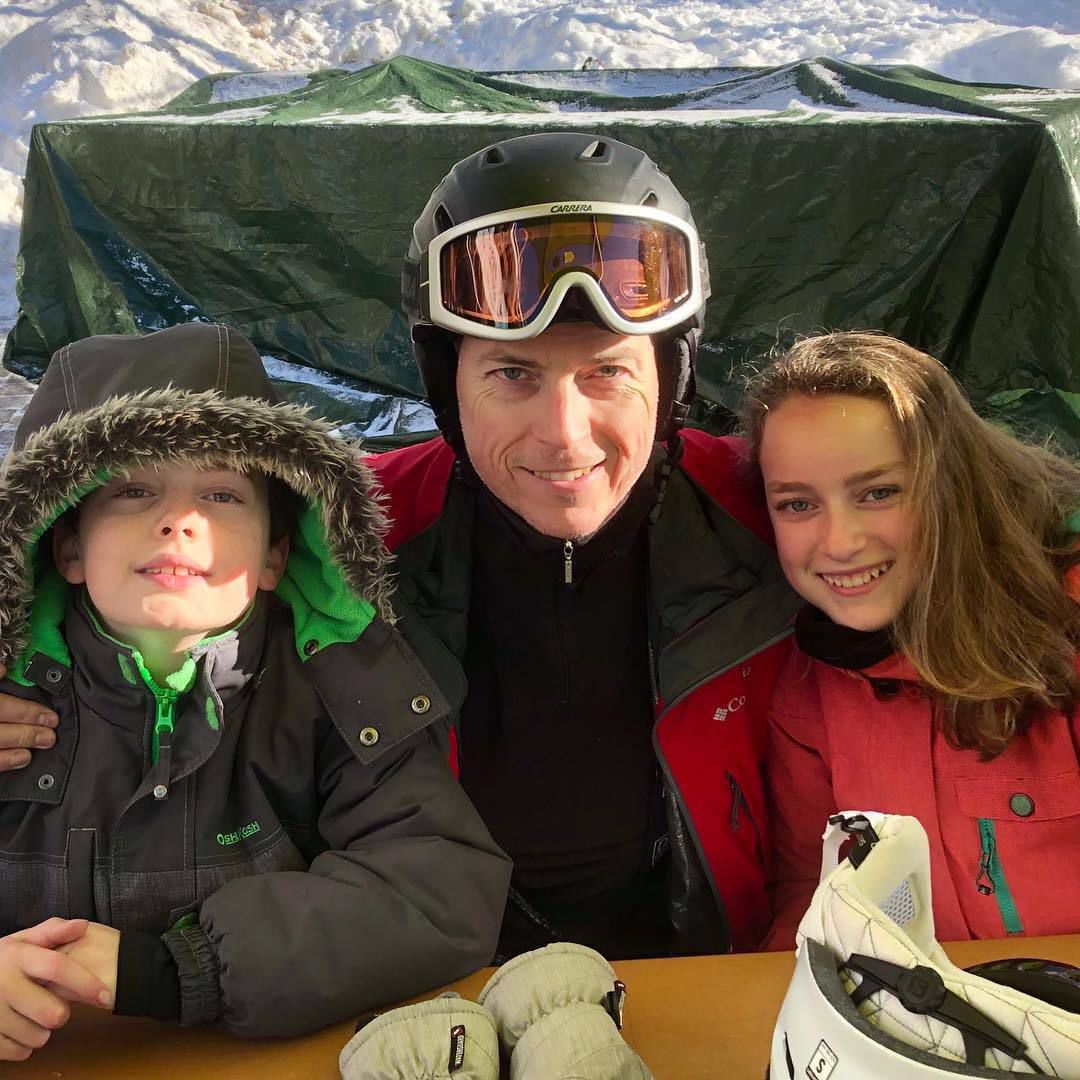
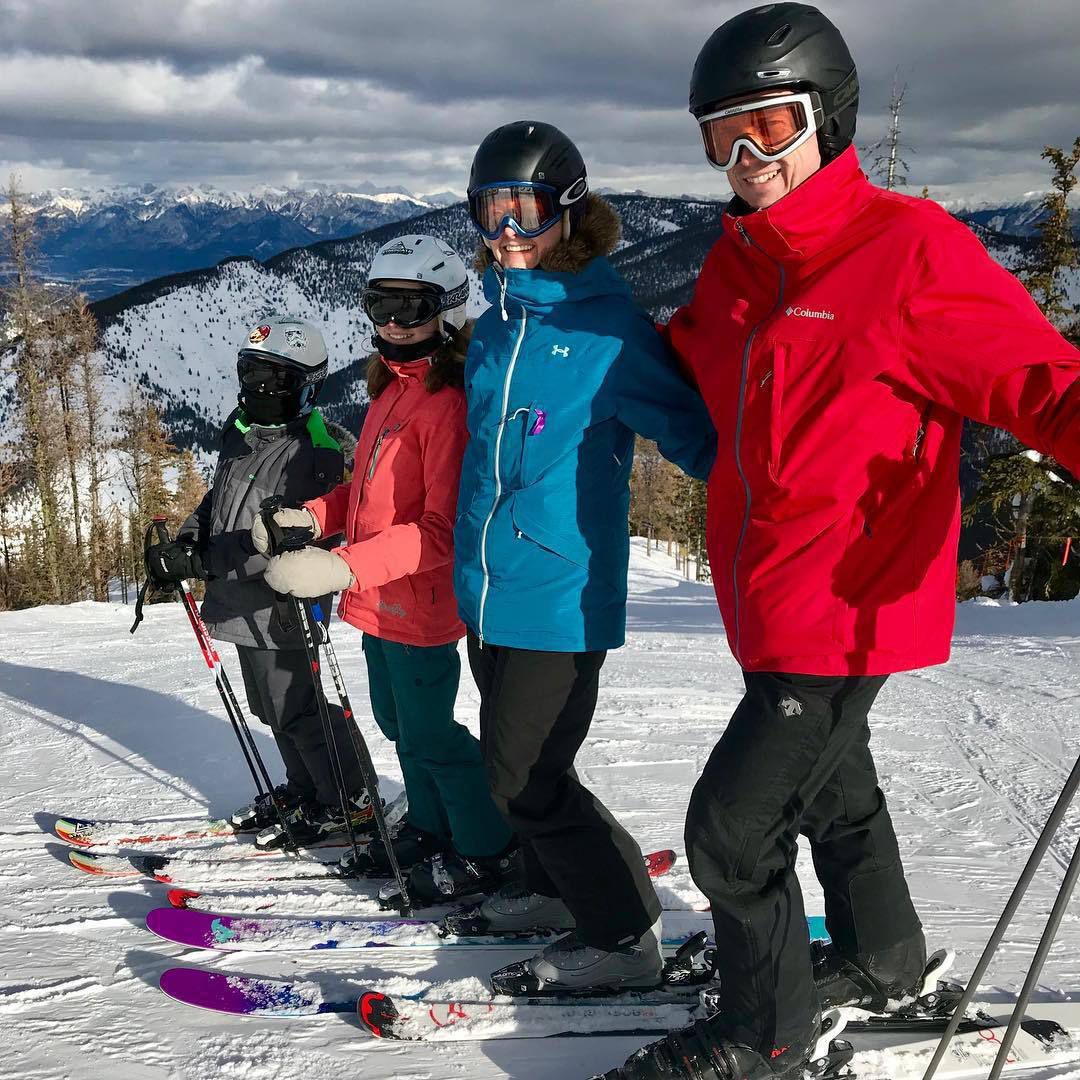
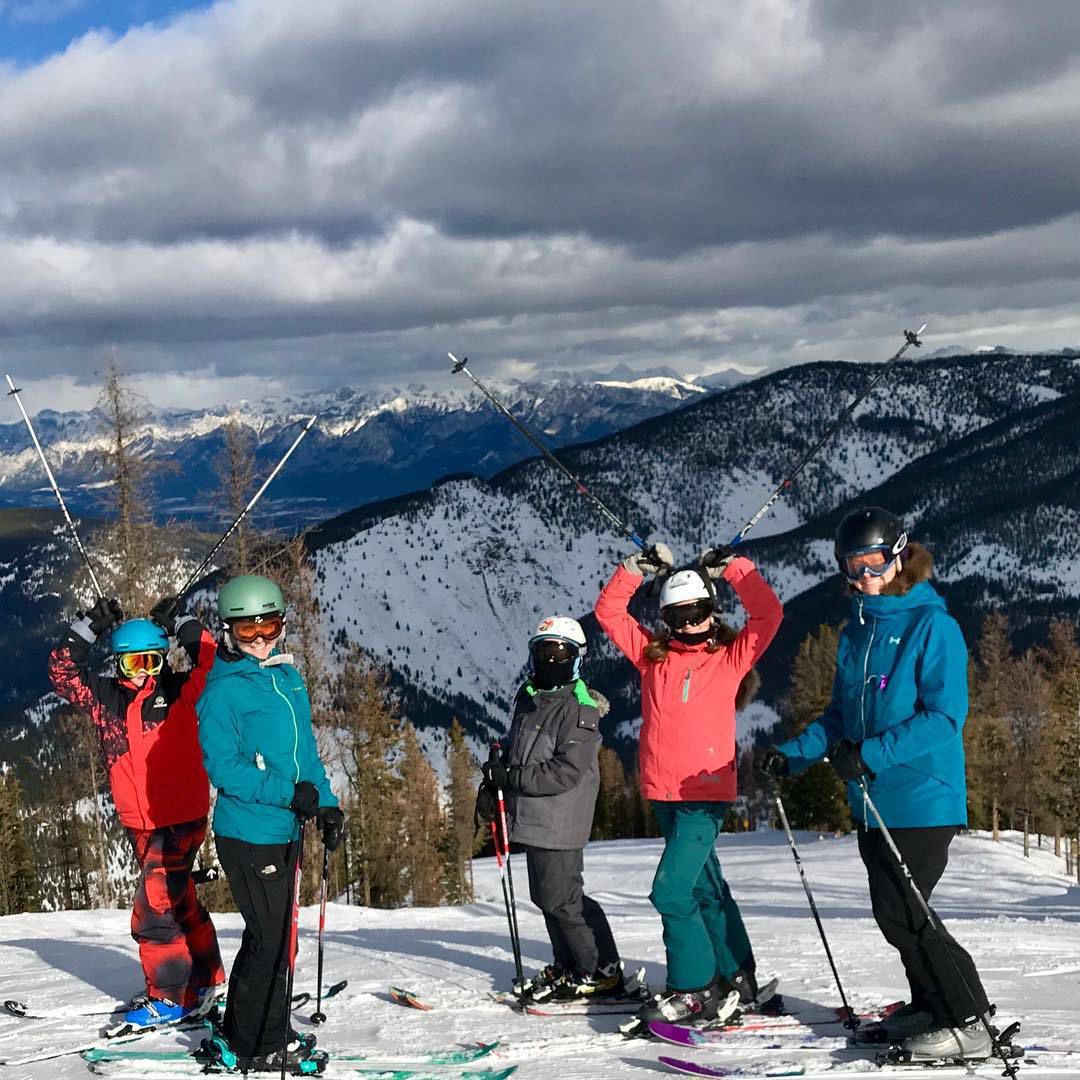
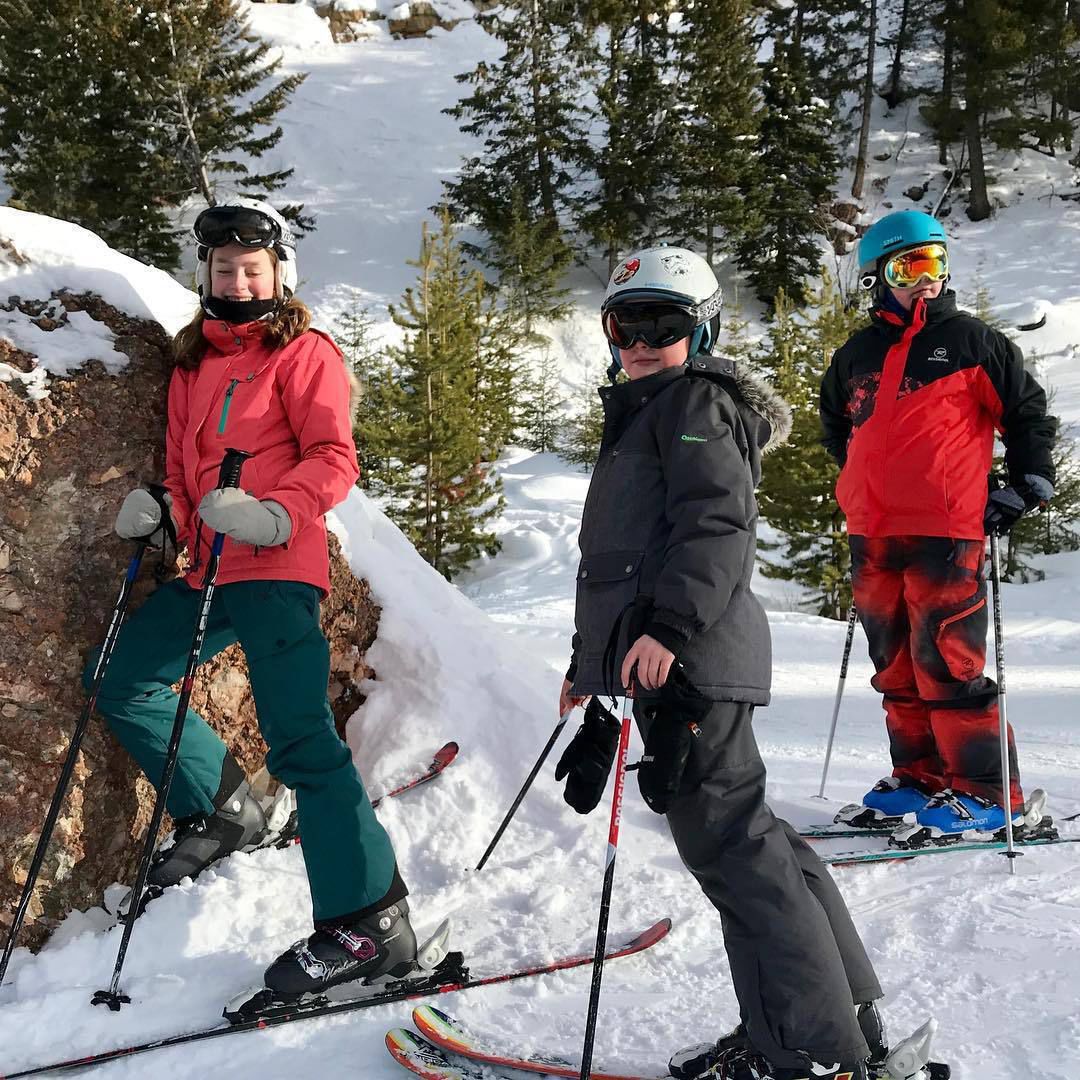
The Nugget Squad
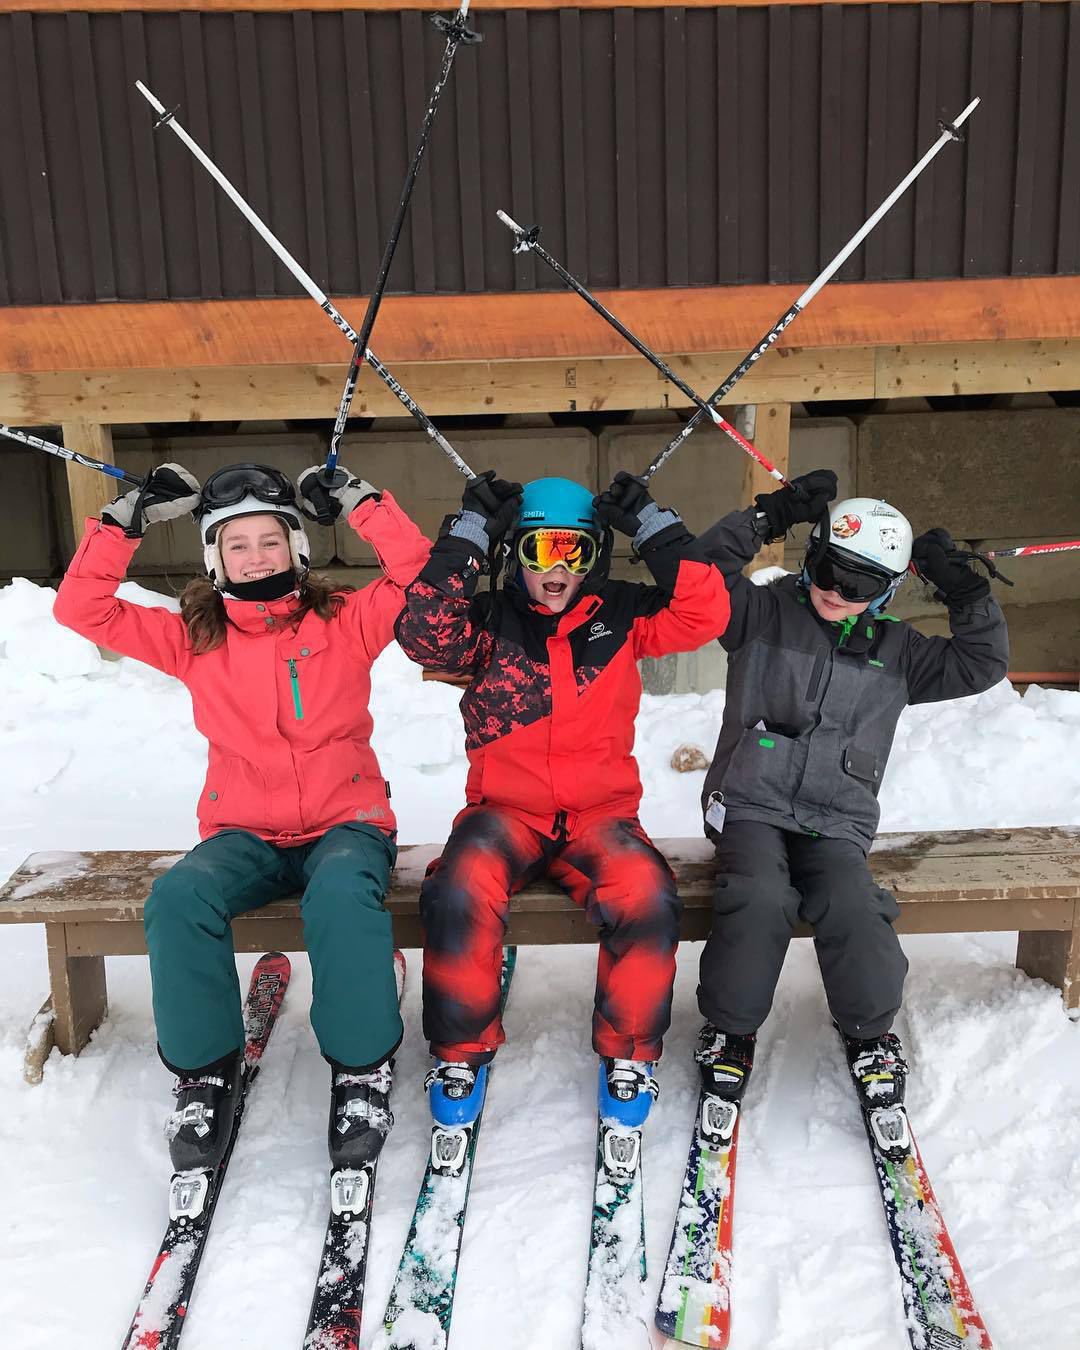

Another glorious day

A great first day on the mountain!
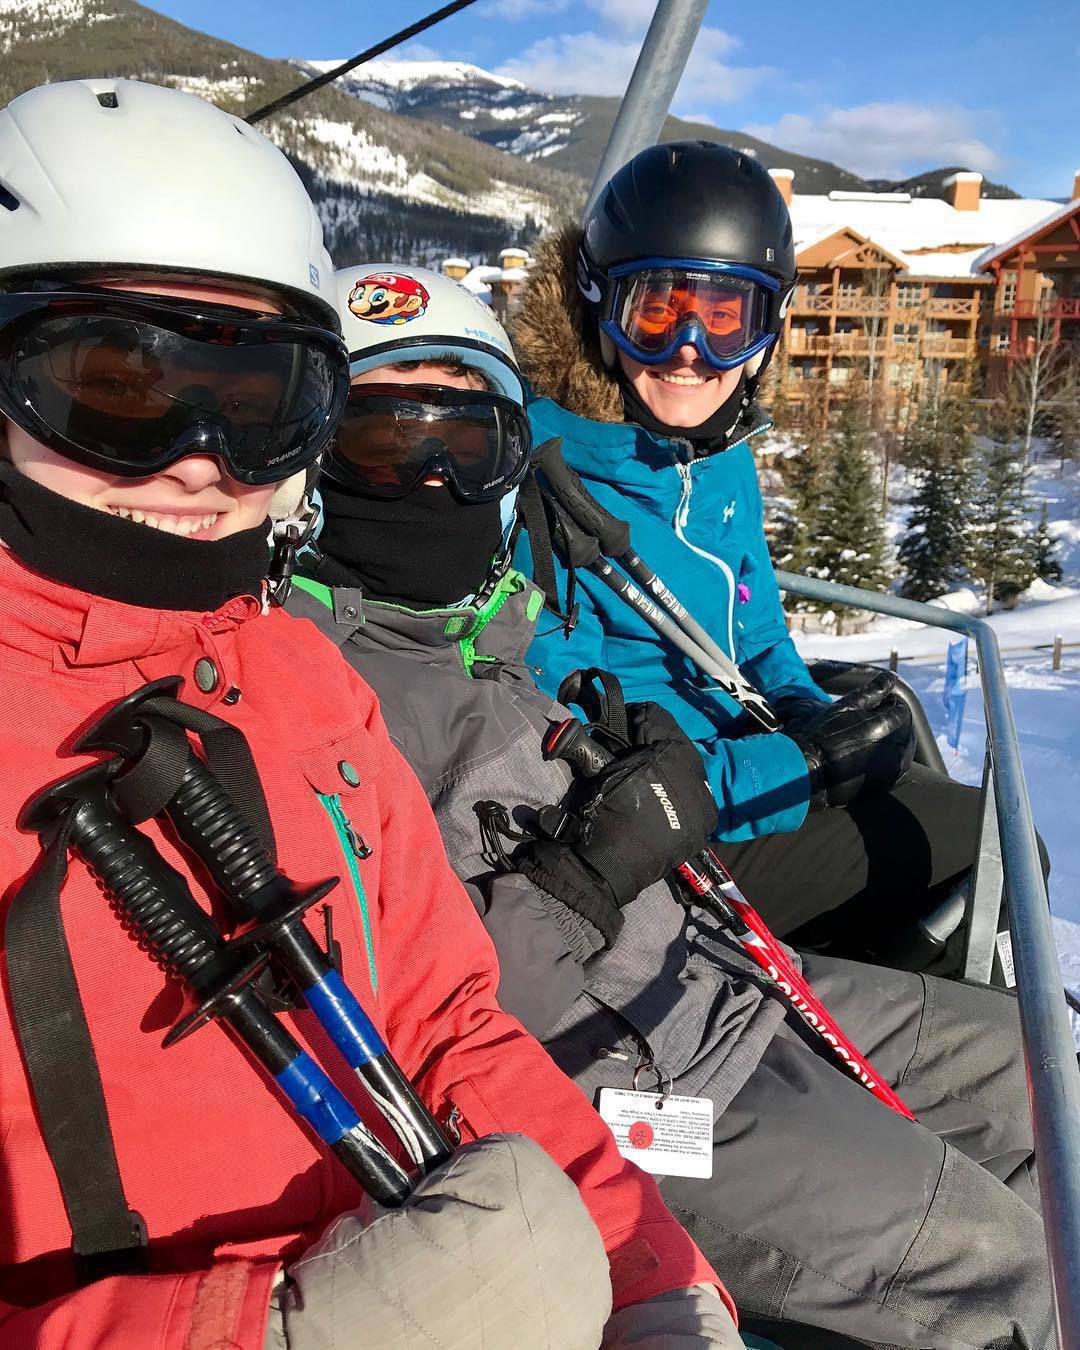
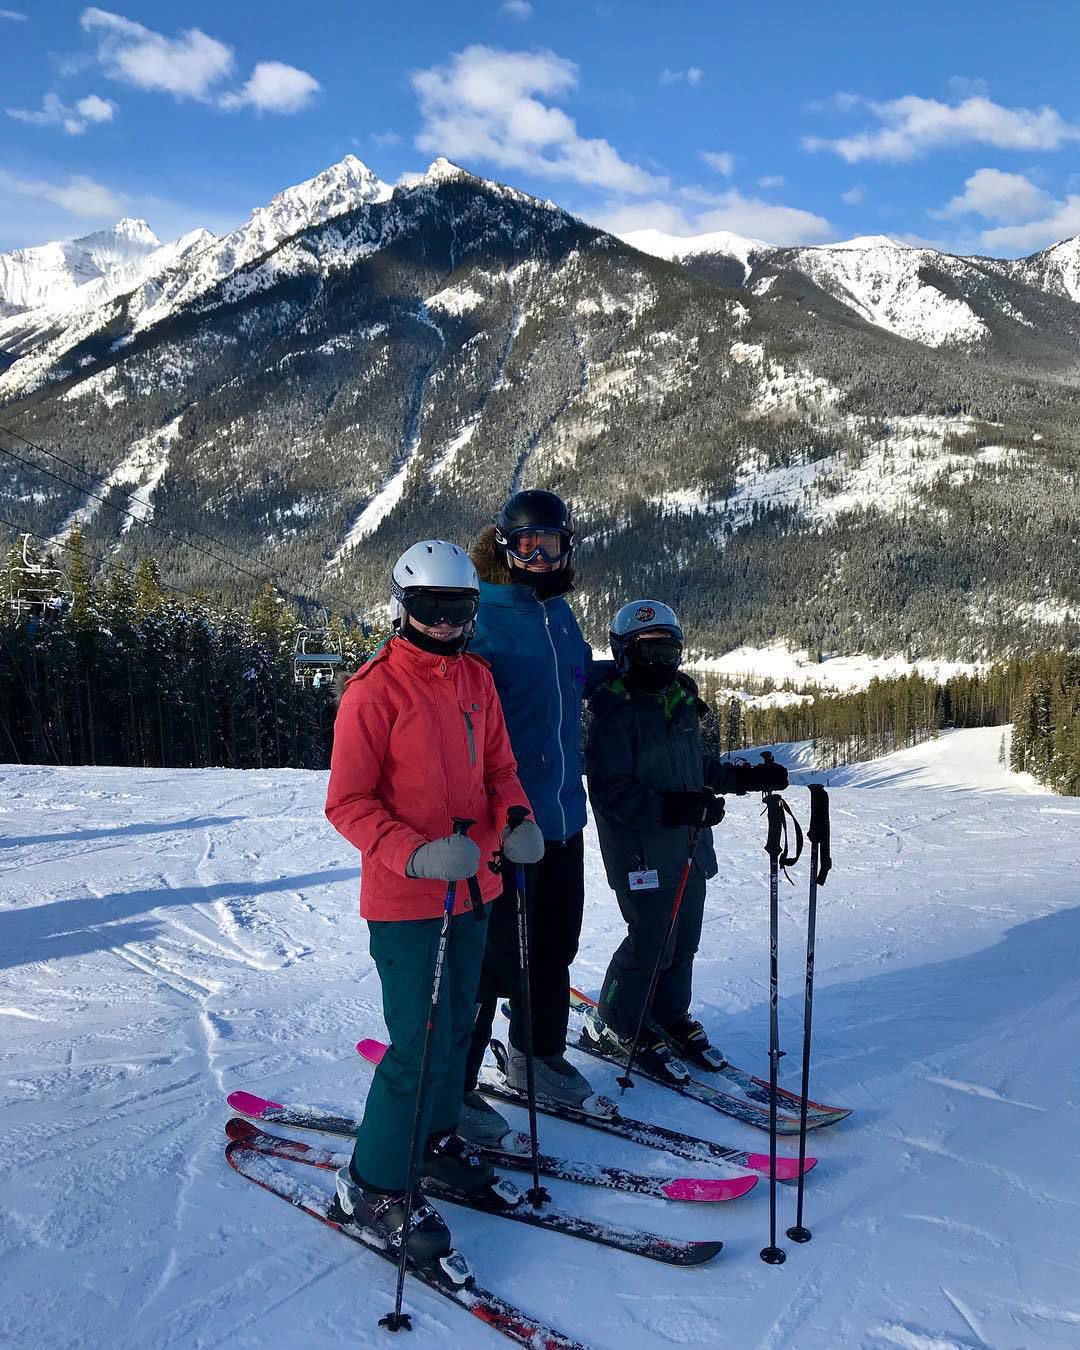

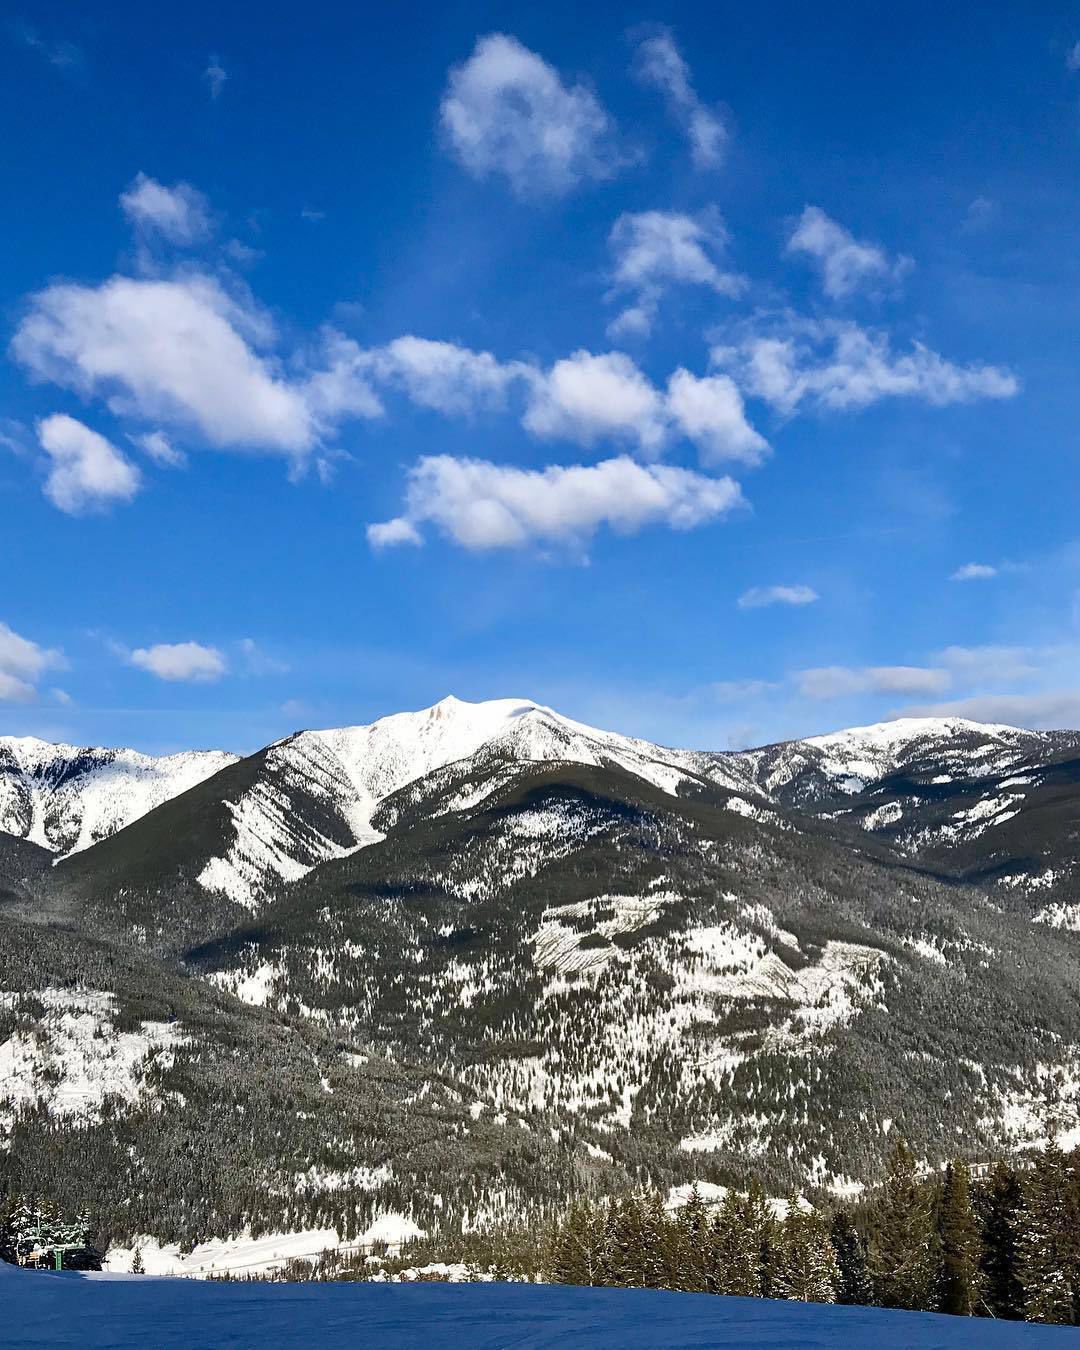

Warming up ⛷
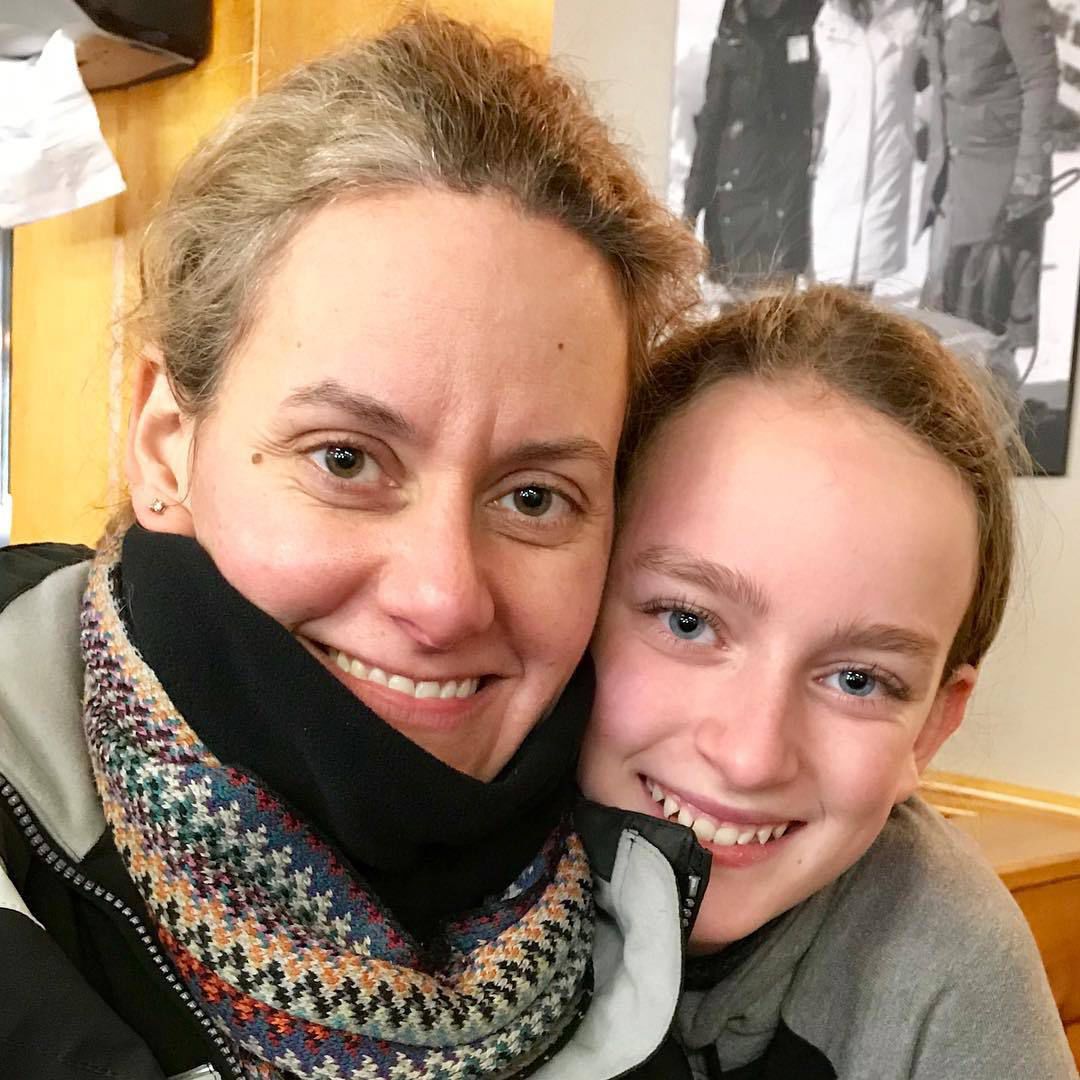
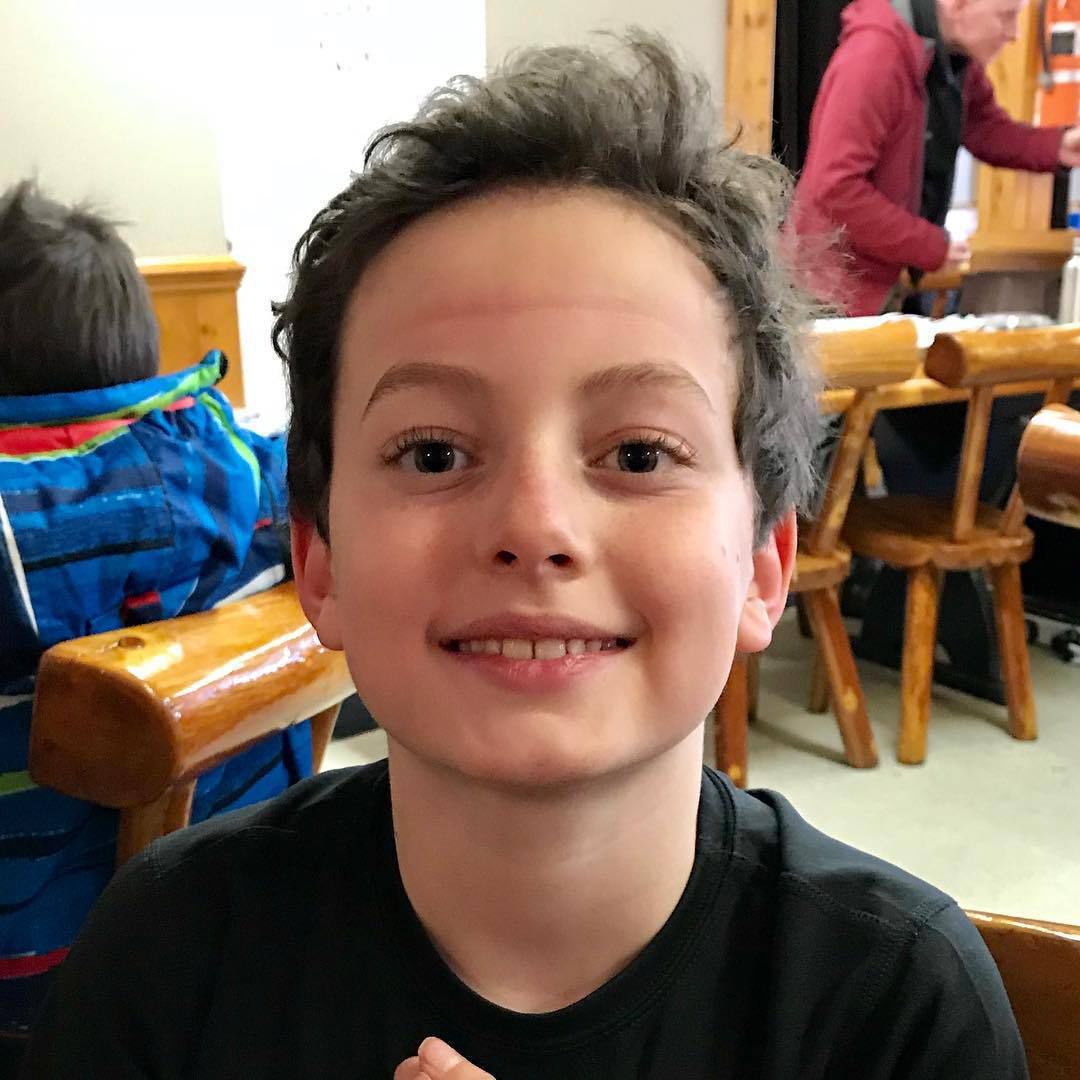
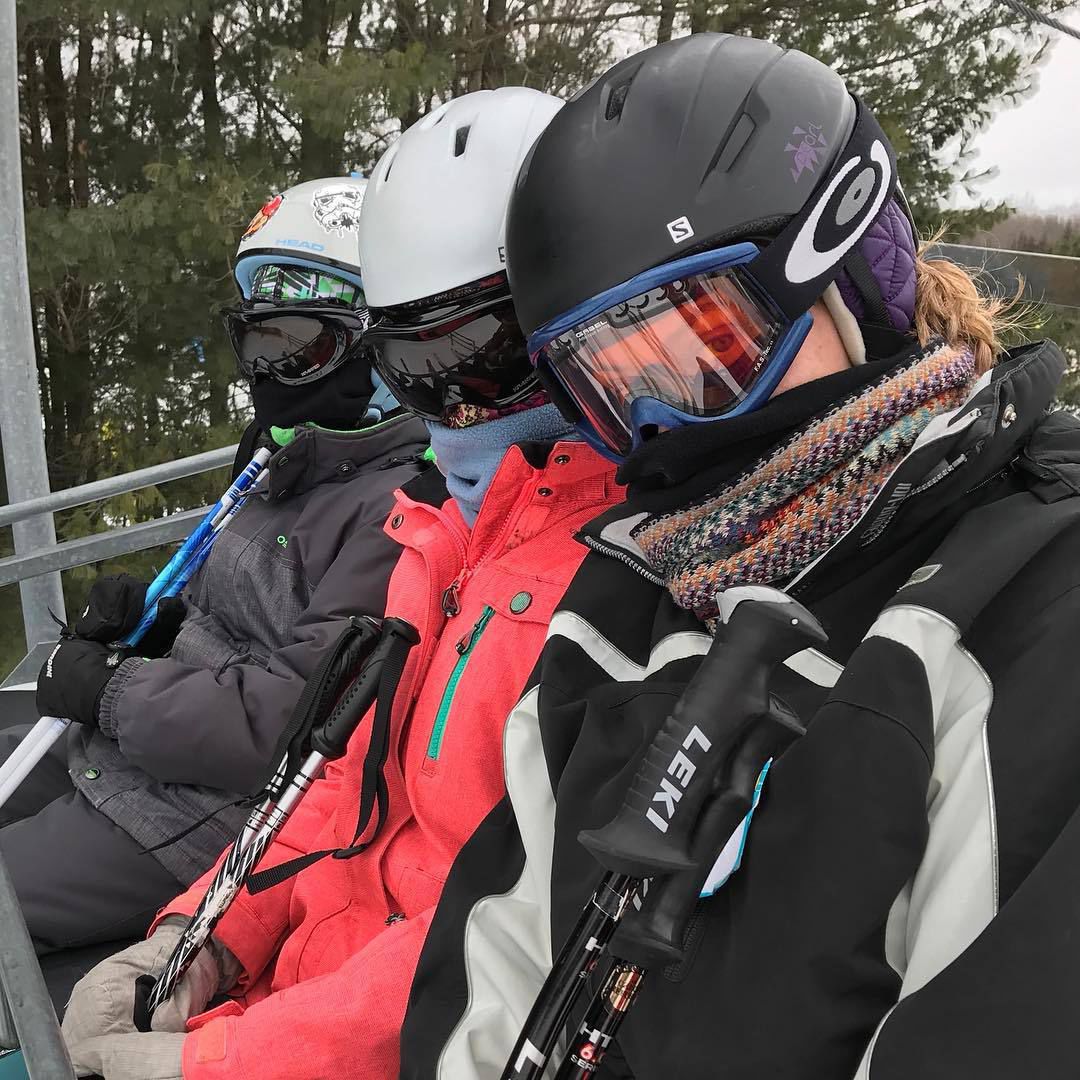
-20 degrees, but there are smiles under the scarves ⛷
I’m keen to adopt an iPad first approach. This MacStories article is a good primer and motivator www.macstories.net/stories/t…
The long nightmare of the 24-hour internet outage is over…

For awhile now I’ve been meaning to get serious about automation on iOS. The Siri Shortcuts Field Guide from @macsparky is a great, comprehensive introduction. While taking the course, I built a good dozen useful shortcuts and have many ideas for more.
Ed Harcourt’s album Beyond the End has been great headphone music for at work 🎶 itunes.apple.com/ca/album/…
Fun to be back ⛷
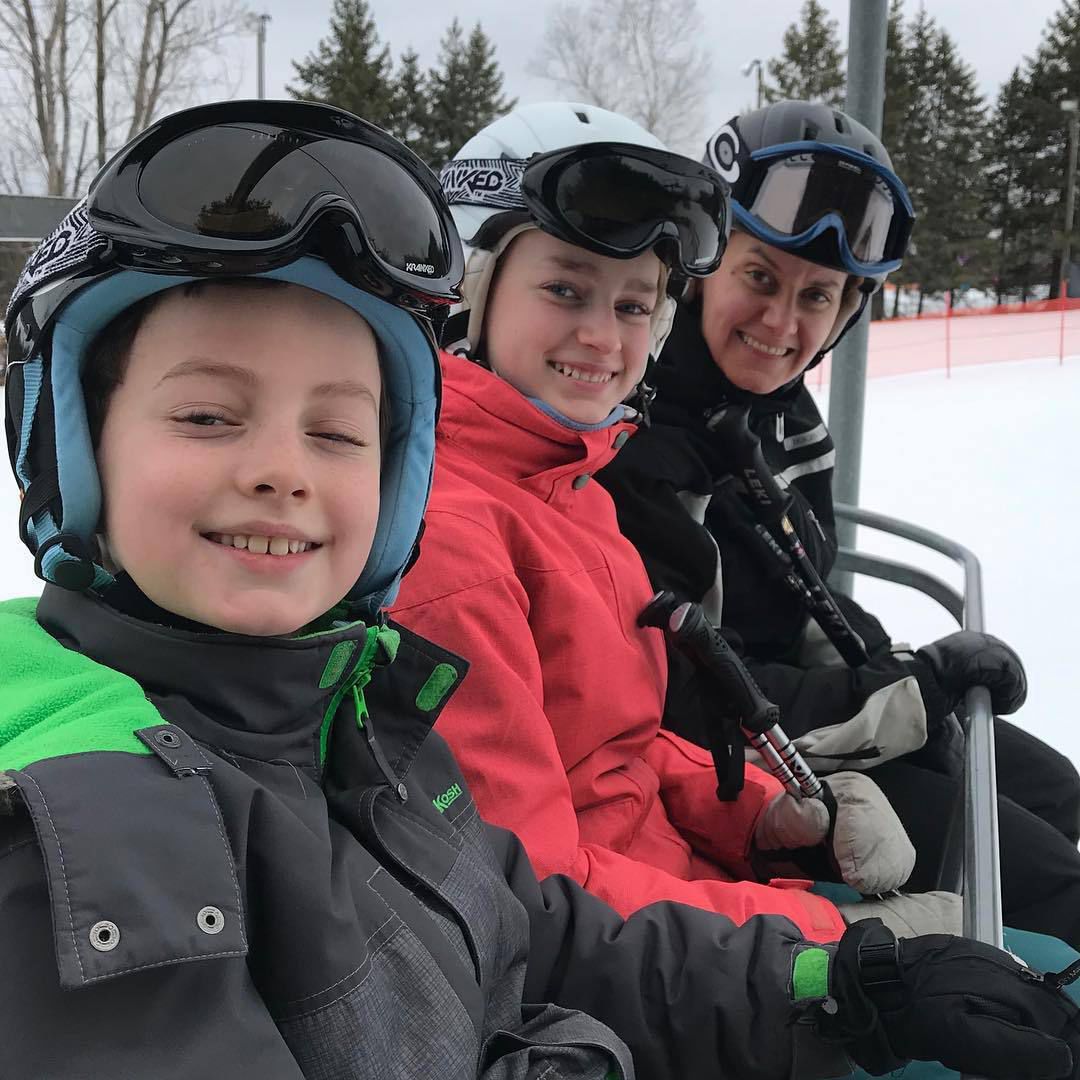
#CozyLife


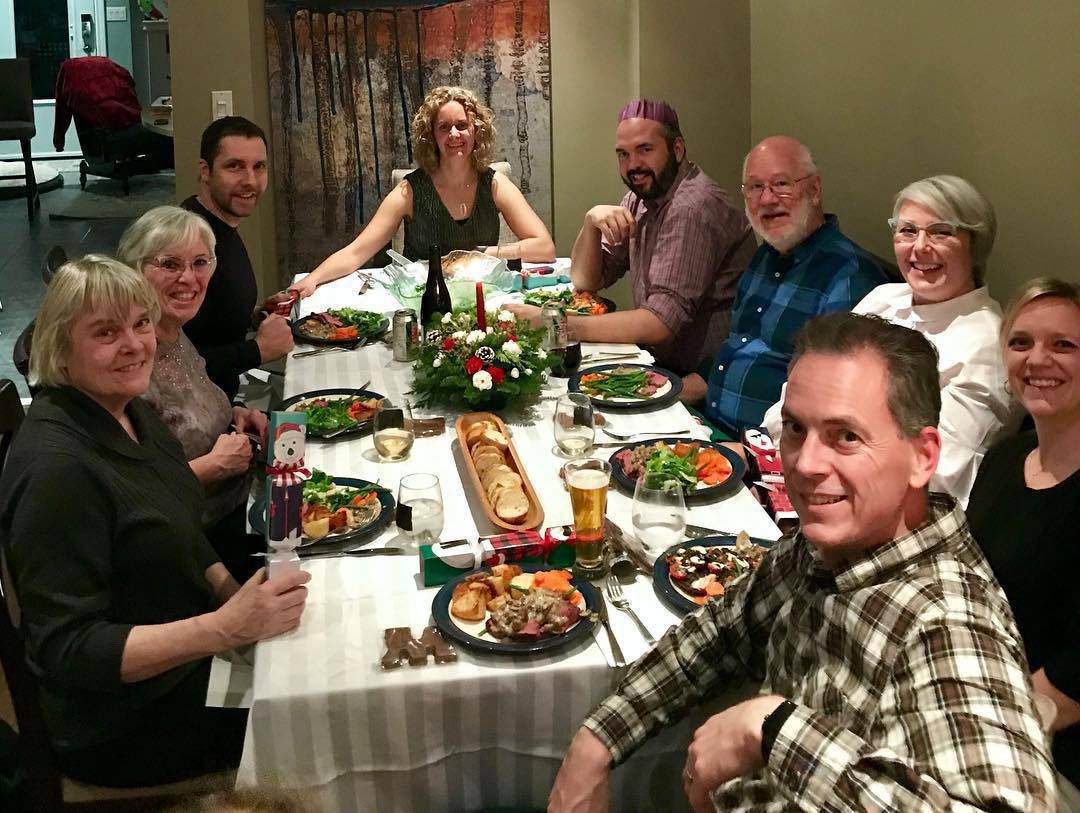
Another Christmas dinner

Good advice from a philosopher on how to disagree constructively:
Many of my best friends think that some of my deeply held beliefs about important issues are obviously false or even nonsense. Sometimes, they tell me so to my face. How can we still be friends? Part of the answer is that these friends and I are philosophers, and philosophers learn how to deal with positions on the edge of sanity.