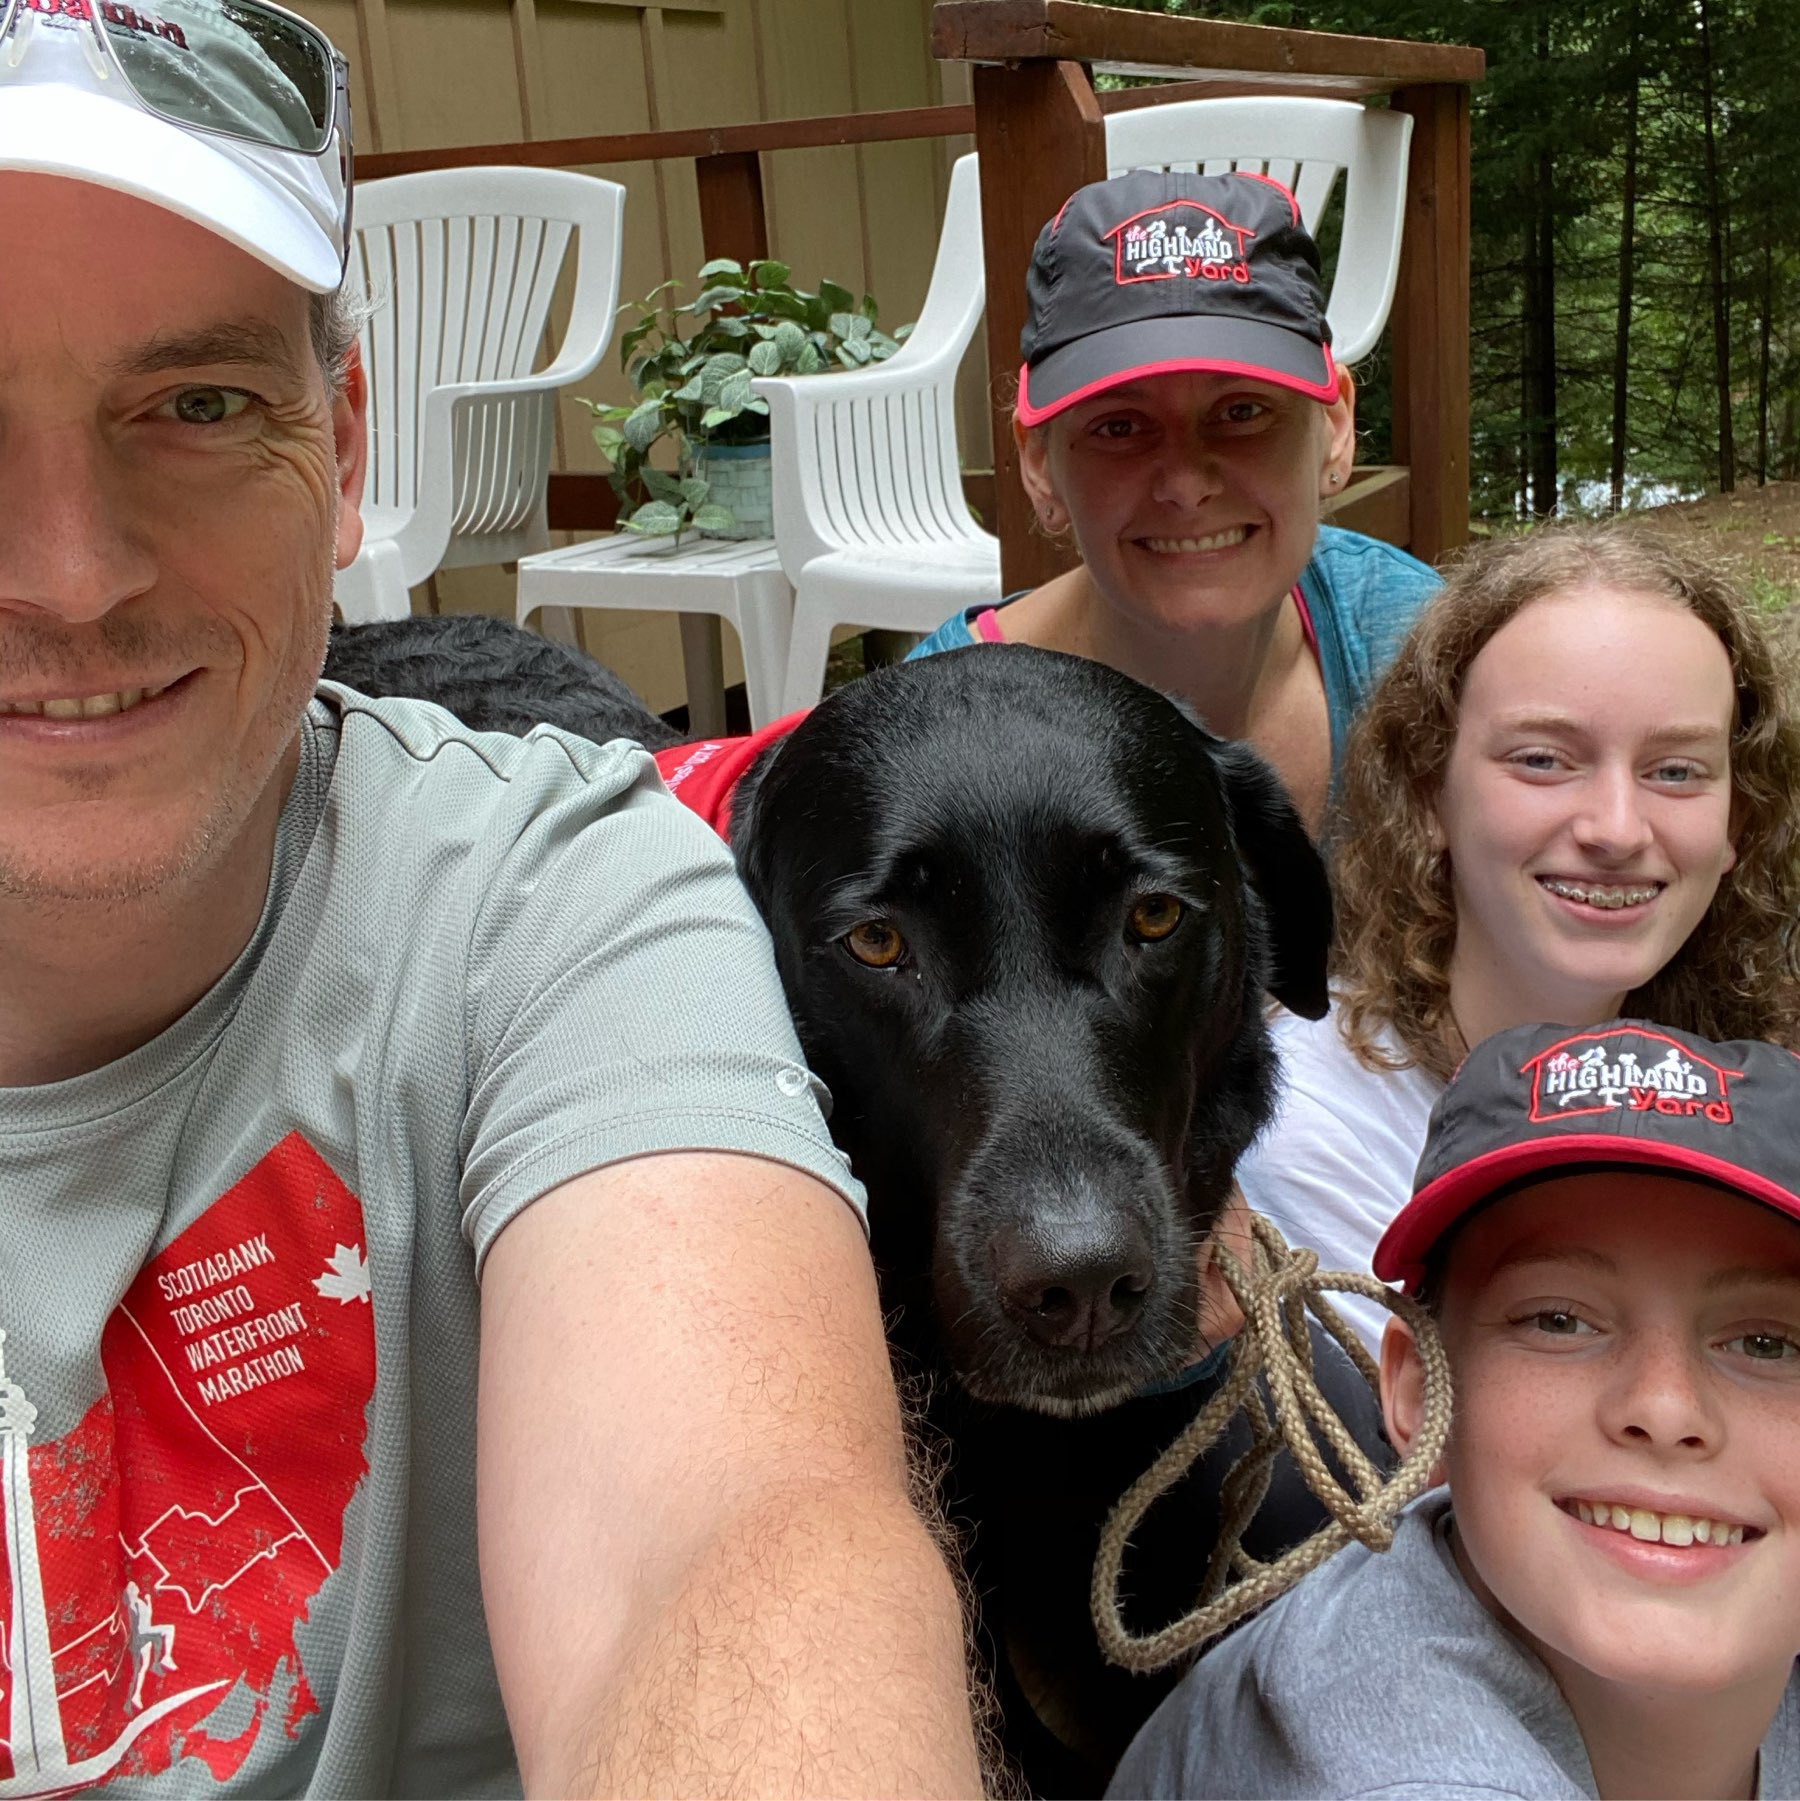
Poured rain all day yesterday. So we’re a day late for the Highland Yard run. We didn’t want to miss supporting this important cause!
Poured rain all day yesterday. So we’re a day late for the Highland Yard run. We didn’t want to miss supporting this important cause!
In the lake within a few minutes of arriving

I’m ready for my vacation to start!
Even though I knew how it ends, Free Solo is still an intense movie. I appreciated how Sanni (Alex’s girlfriend) and the video crew became important parts of the story
I haven’t yet adopted the minimalist style of my iPhone for my iPad. Rather, I’ve found that setting up “task oriented” Shortcuts on my home screen is a good alternative to arranging lots of app icons.
The one I use the most is a “Reading” Shortcut, since this is my dominant use of the iPad. Nothing particularly fancy. Just a list of potential reading sources and each one starts up a Timery timer, since I like to track how much time I’m reading.
Here’s a screenshot of the first few actions:
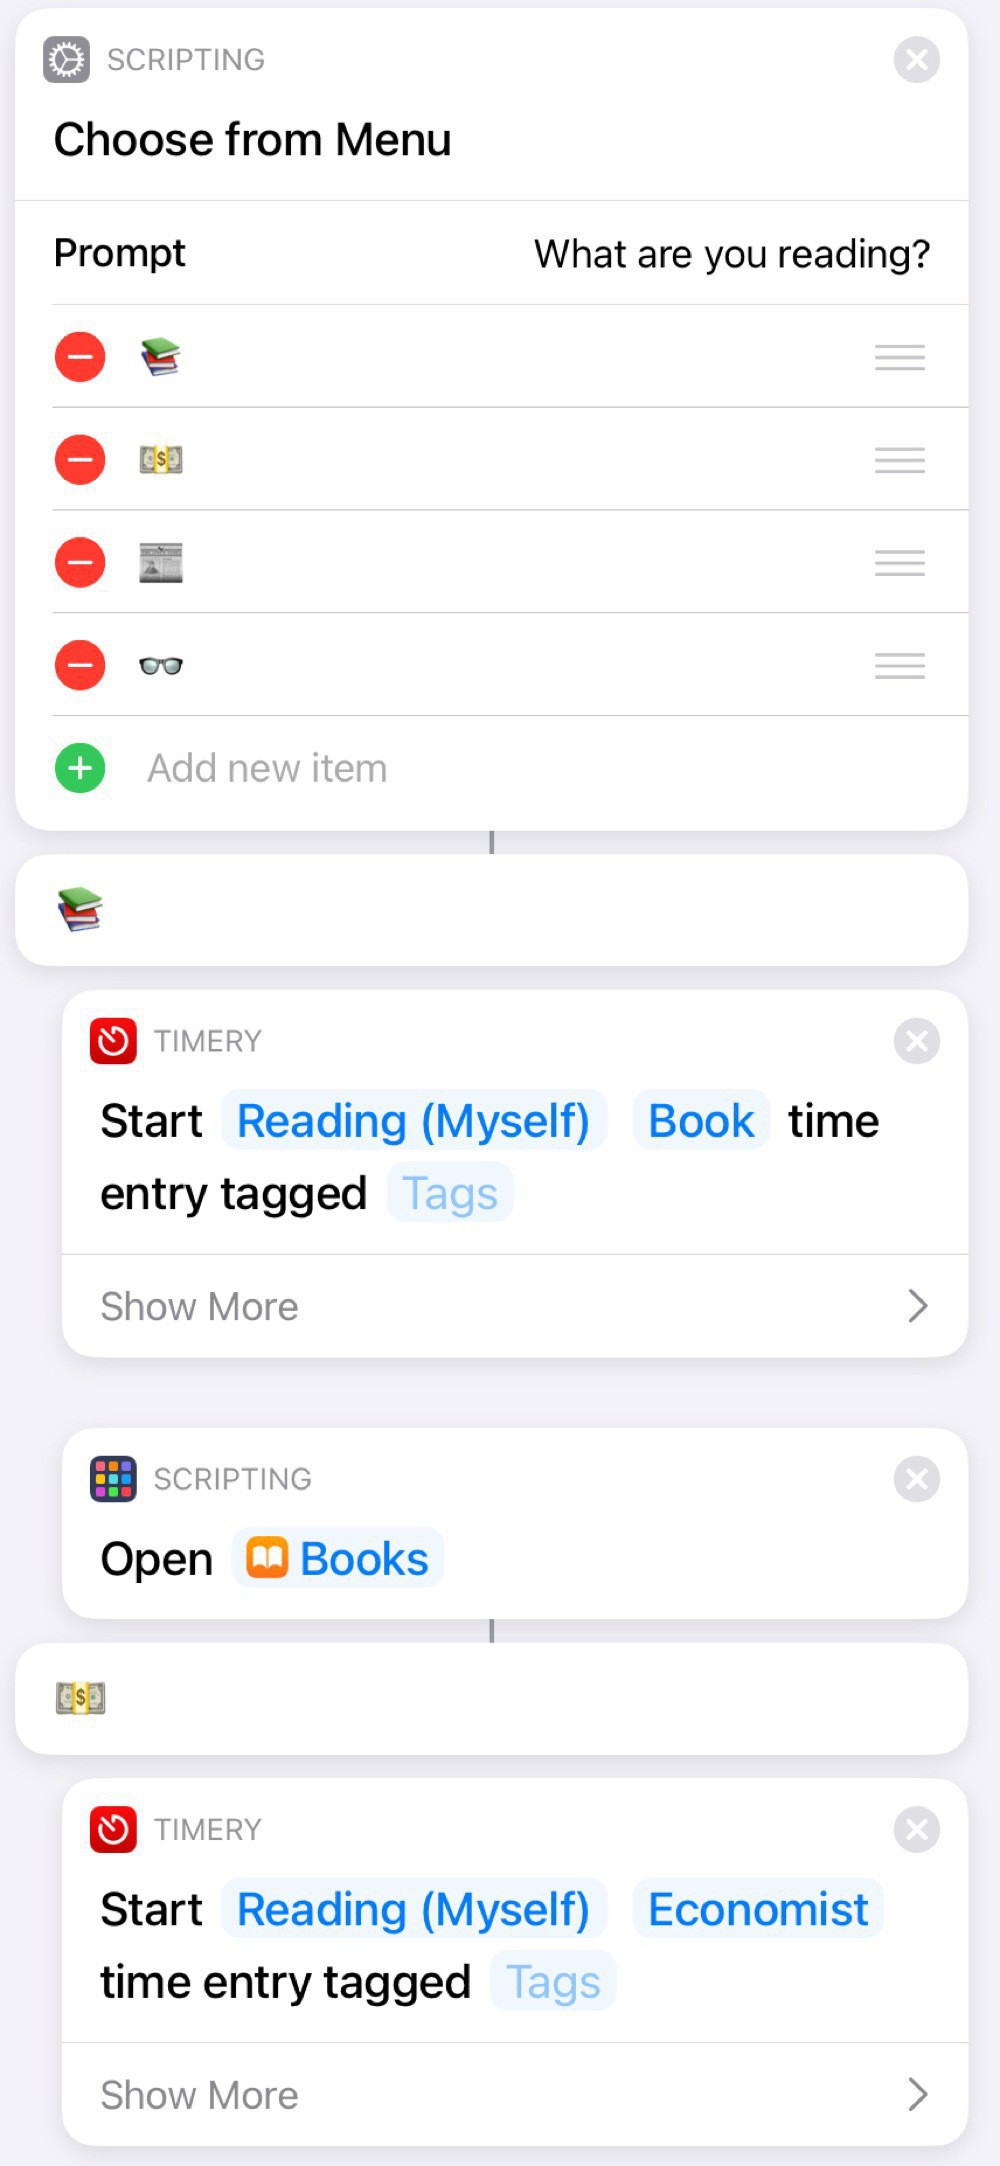
I like the bit of whimsy from using emoticons:
A nice feature of using a Shortcut for this is that I can add other actions, such as turning on Do Not Disturb or starting a specific playlist. I can also add and subtract reading sources over time, depending on my current habits. For example, the first one was Libby for a while, since I was reading lots of library books.
This is another example of how relatively simple Shortcuts can really help optimize how you use your iOS devices.
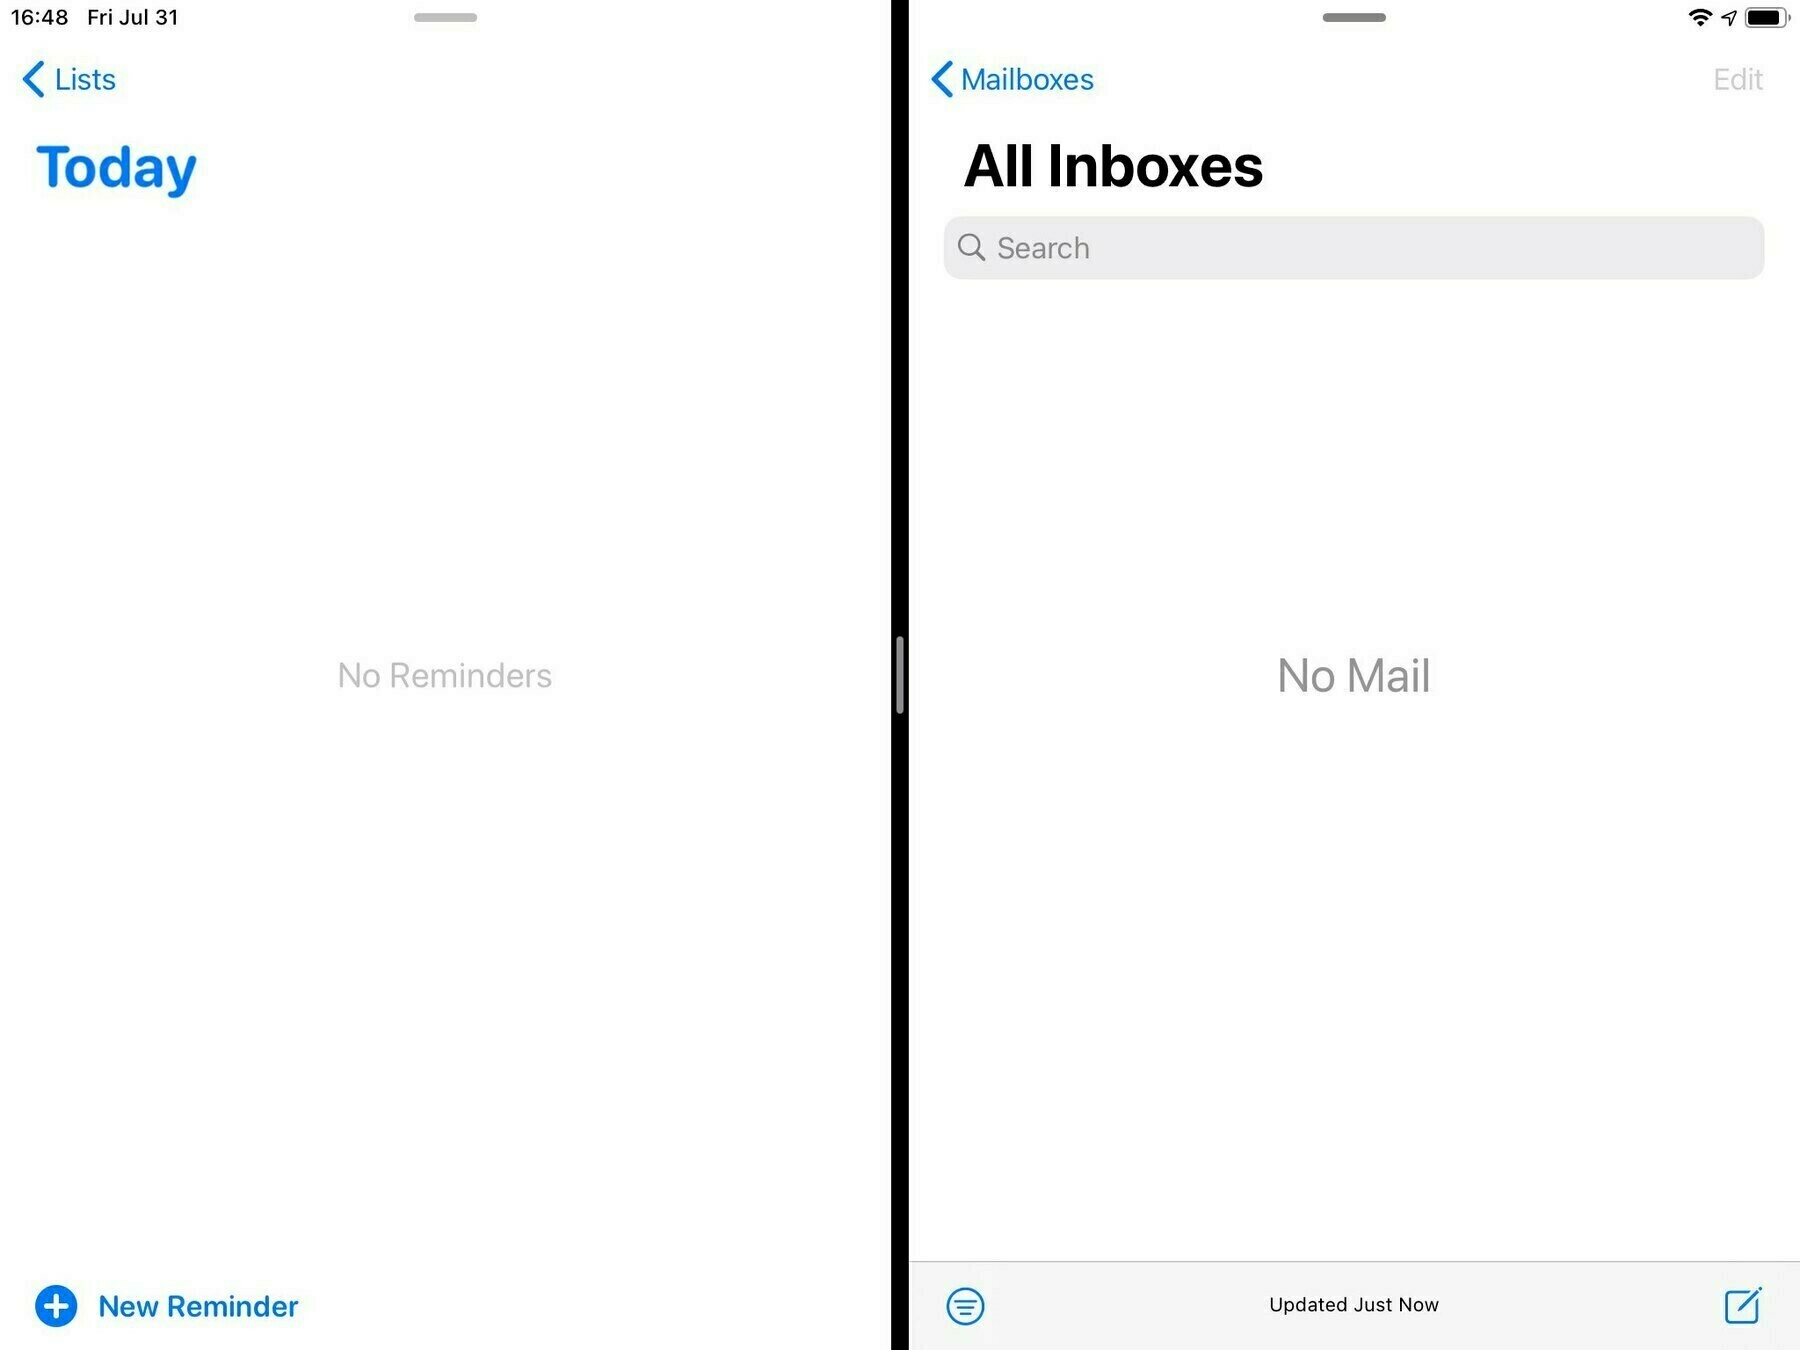
I’ve been keeping a “director’s commentary” of my experiences in Day One since August 2, 2012 (5,882 entries and counting). I’ve found this incredibly helpful and really enjoy the “On This Day” feature that shows all of my past entries on a particular day.
For the past few months, I’ve added in a routine based on the “5 minute PM” template which prompts me to add three things that happened that day and one thing I could have done to make the day better. This is a great point of reflection and will build up a nice library of what I’ve been doing over time.
My days seem like such a whirlwind sometimes that I actually have trouble remembering what I did that day. So, my new habit is to scroll through my Today view in Agenda. This shows me all of my notes from the day’s meetings. I’ve also created a Shortcut that creates a new note in Agenda with all of my completed tasks from Reminders. This is a useful reminder of any non-meeting based things I’ve done (not everything is a meeting, yet).
I’m finding this new routine to be a very helpful part of my daily shutdown routine: I often identify the most important thing to do tomorrow by reviewing what I did today. And starting tomorrow off with my top priority already identified really helps get the day going quickly.
Skipping past the dramatic title, Our remote work future is going to suck makes important points about the risks of remote work. These are all important things to watch out for in our teams, particularly the potential for stifling of mentorship.
Some unfortunate formatting in the CBC’s otherwise well done coronavirus tracker. At first glance, that’s a really big number

A small thing, but I’m finding the automatic conference call link detection in Fantastical is saving me a great amount of effort, given my days are now filled with Teams meetings
The novelty of all of us working from home is wearing off

The Aleph Extraction by Dan Moren is a fun read and worthy sequel to the great Bayern Agenda. The mix of cold-war thriller and sci-fi setting is definitely in my sweet spot 📚
A scary, but important, conversation on the Making Sense podcast about the threat of nuclear weapons
watchOS 7 has some interesting new features for enhancing and sharing watch faces. After an initial explosion of developing many special purpose watch faces, I’ve settled on two: one for work and another for home.
Both watch faces use the Modular design with the date on the top left, time on the top right, and Messages on the bottom right. I like keeping the faces mostly the same for consistency and muscle memory.
My work watch face than adds the Fantastical complication right in the centre, since I often need to know which meeting I’m about to be late for. Reminders is on the bottom left and Mail in the bottom centre. I have this face set to white to not cause too much distraction.
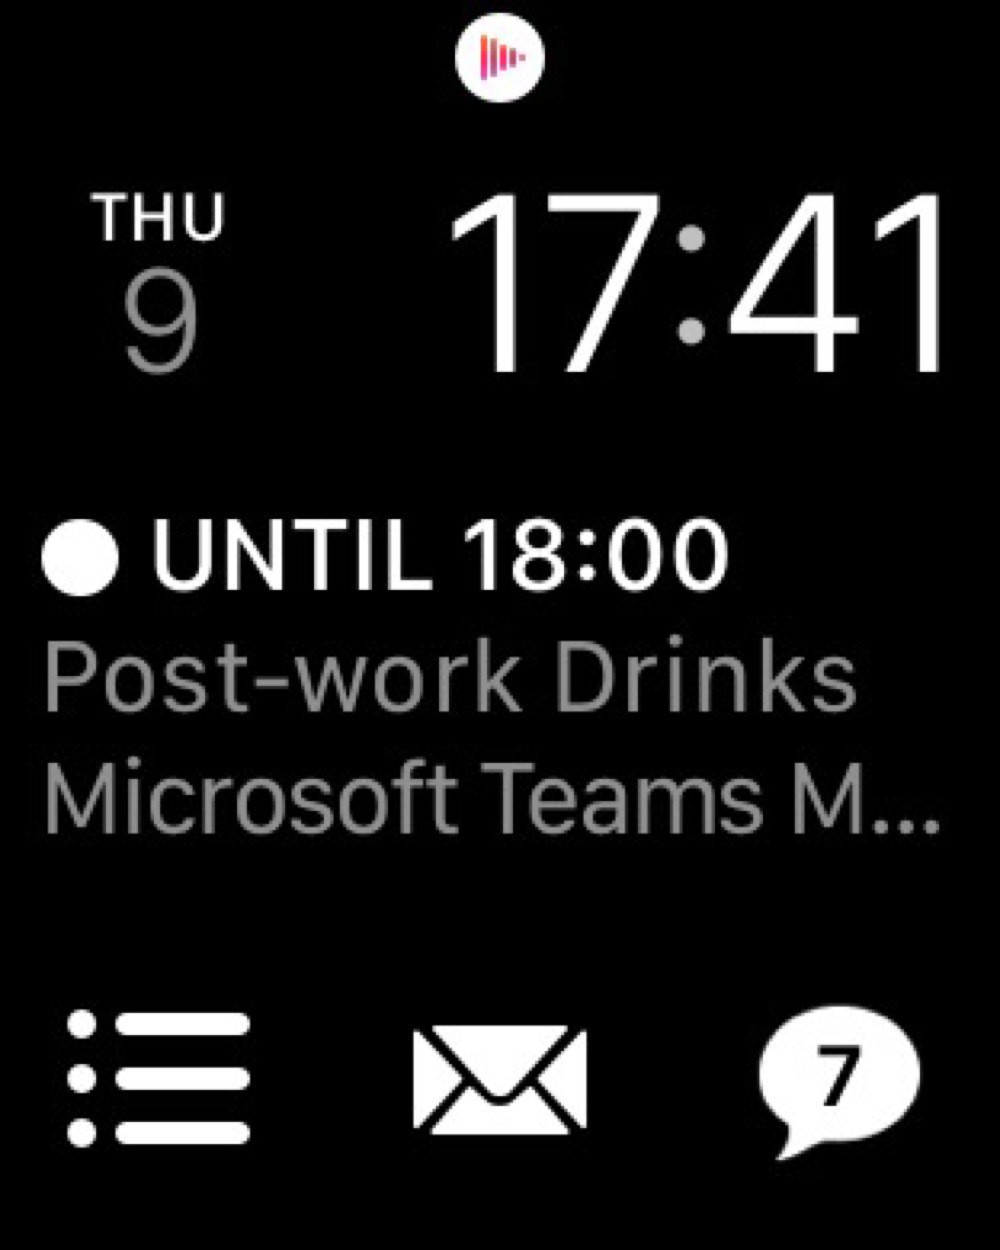
My home watch face swaps in Now Playing in the centre, since I’m often listening to music or podcasts. And I have Activity in the bottom centre. This face is in orange, mostly to distinguish it from the work watch face.
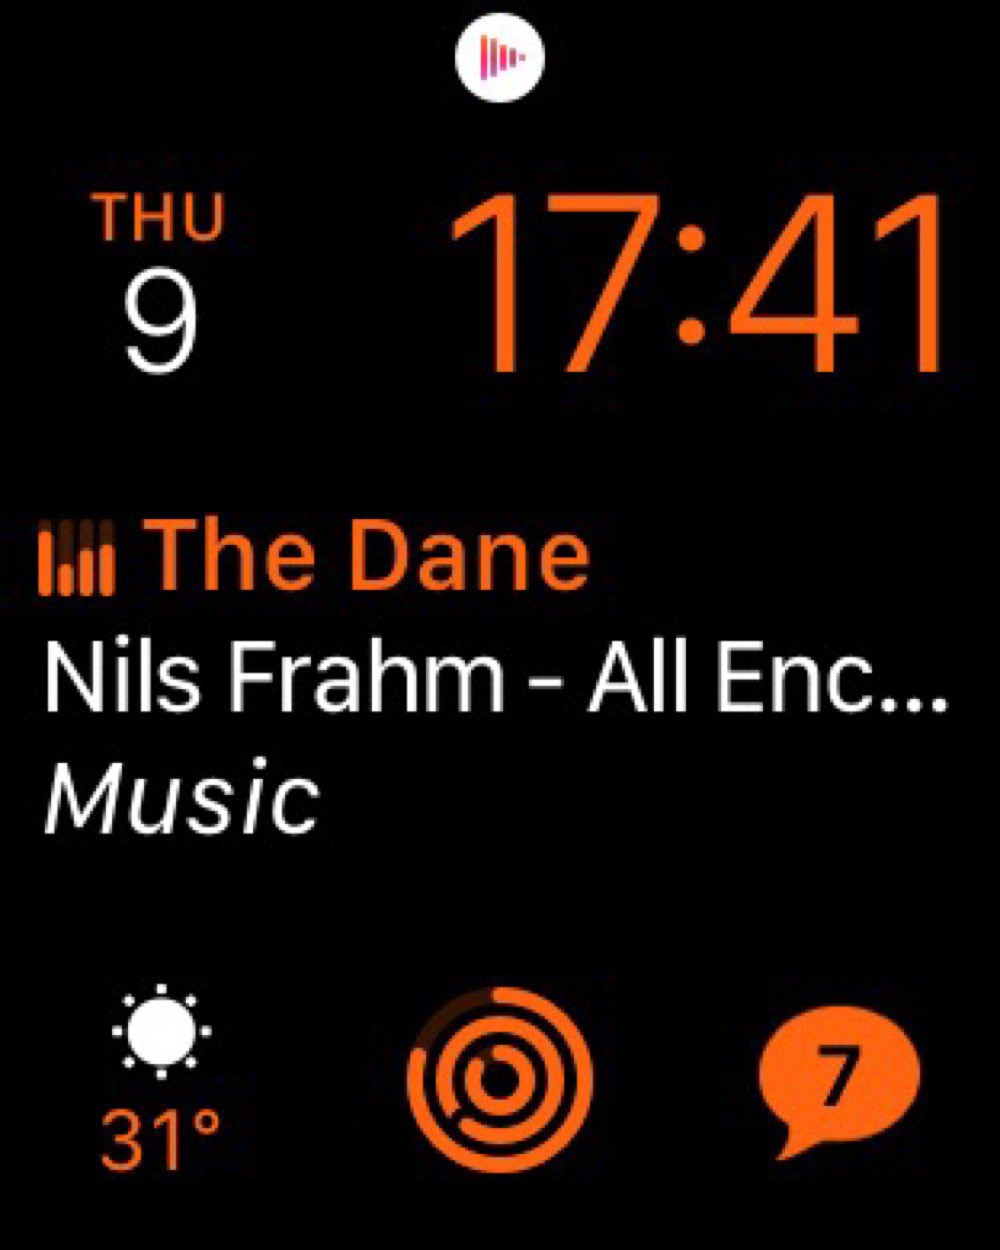
Surprisingly, I’ve found this distinction between a work and home watch face even more important in quarantine. Switching from one face to another really helps enforce the transition between work and non-work when everything is all done at home.
The watch face that I’d really like to use is the Siri watch face. This one is supposed to intelligently expose information based on my habits. Sounds great, but almost never actually works.
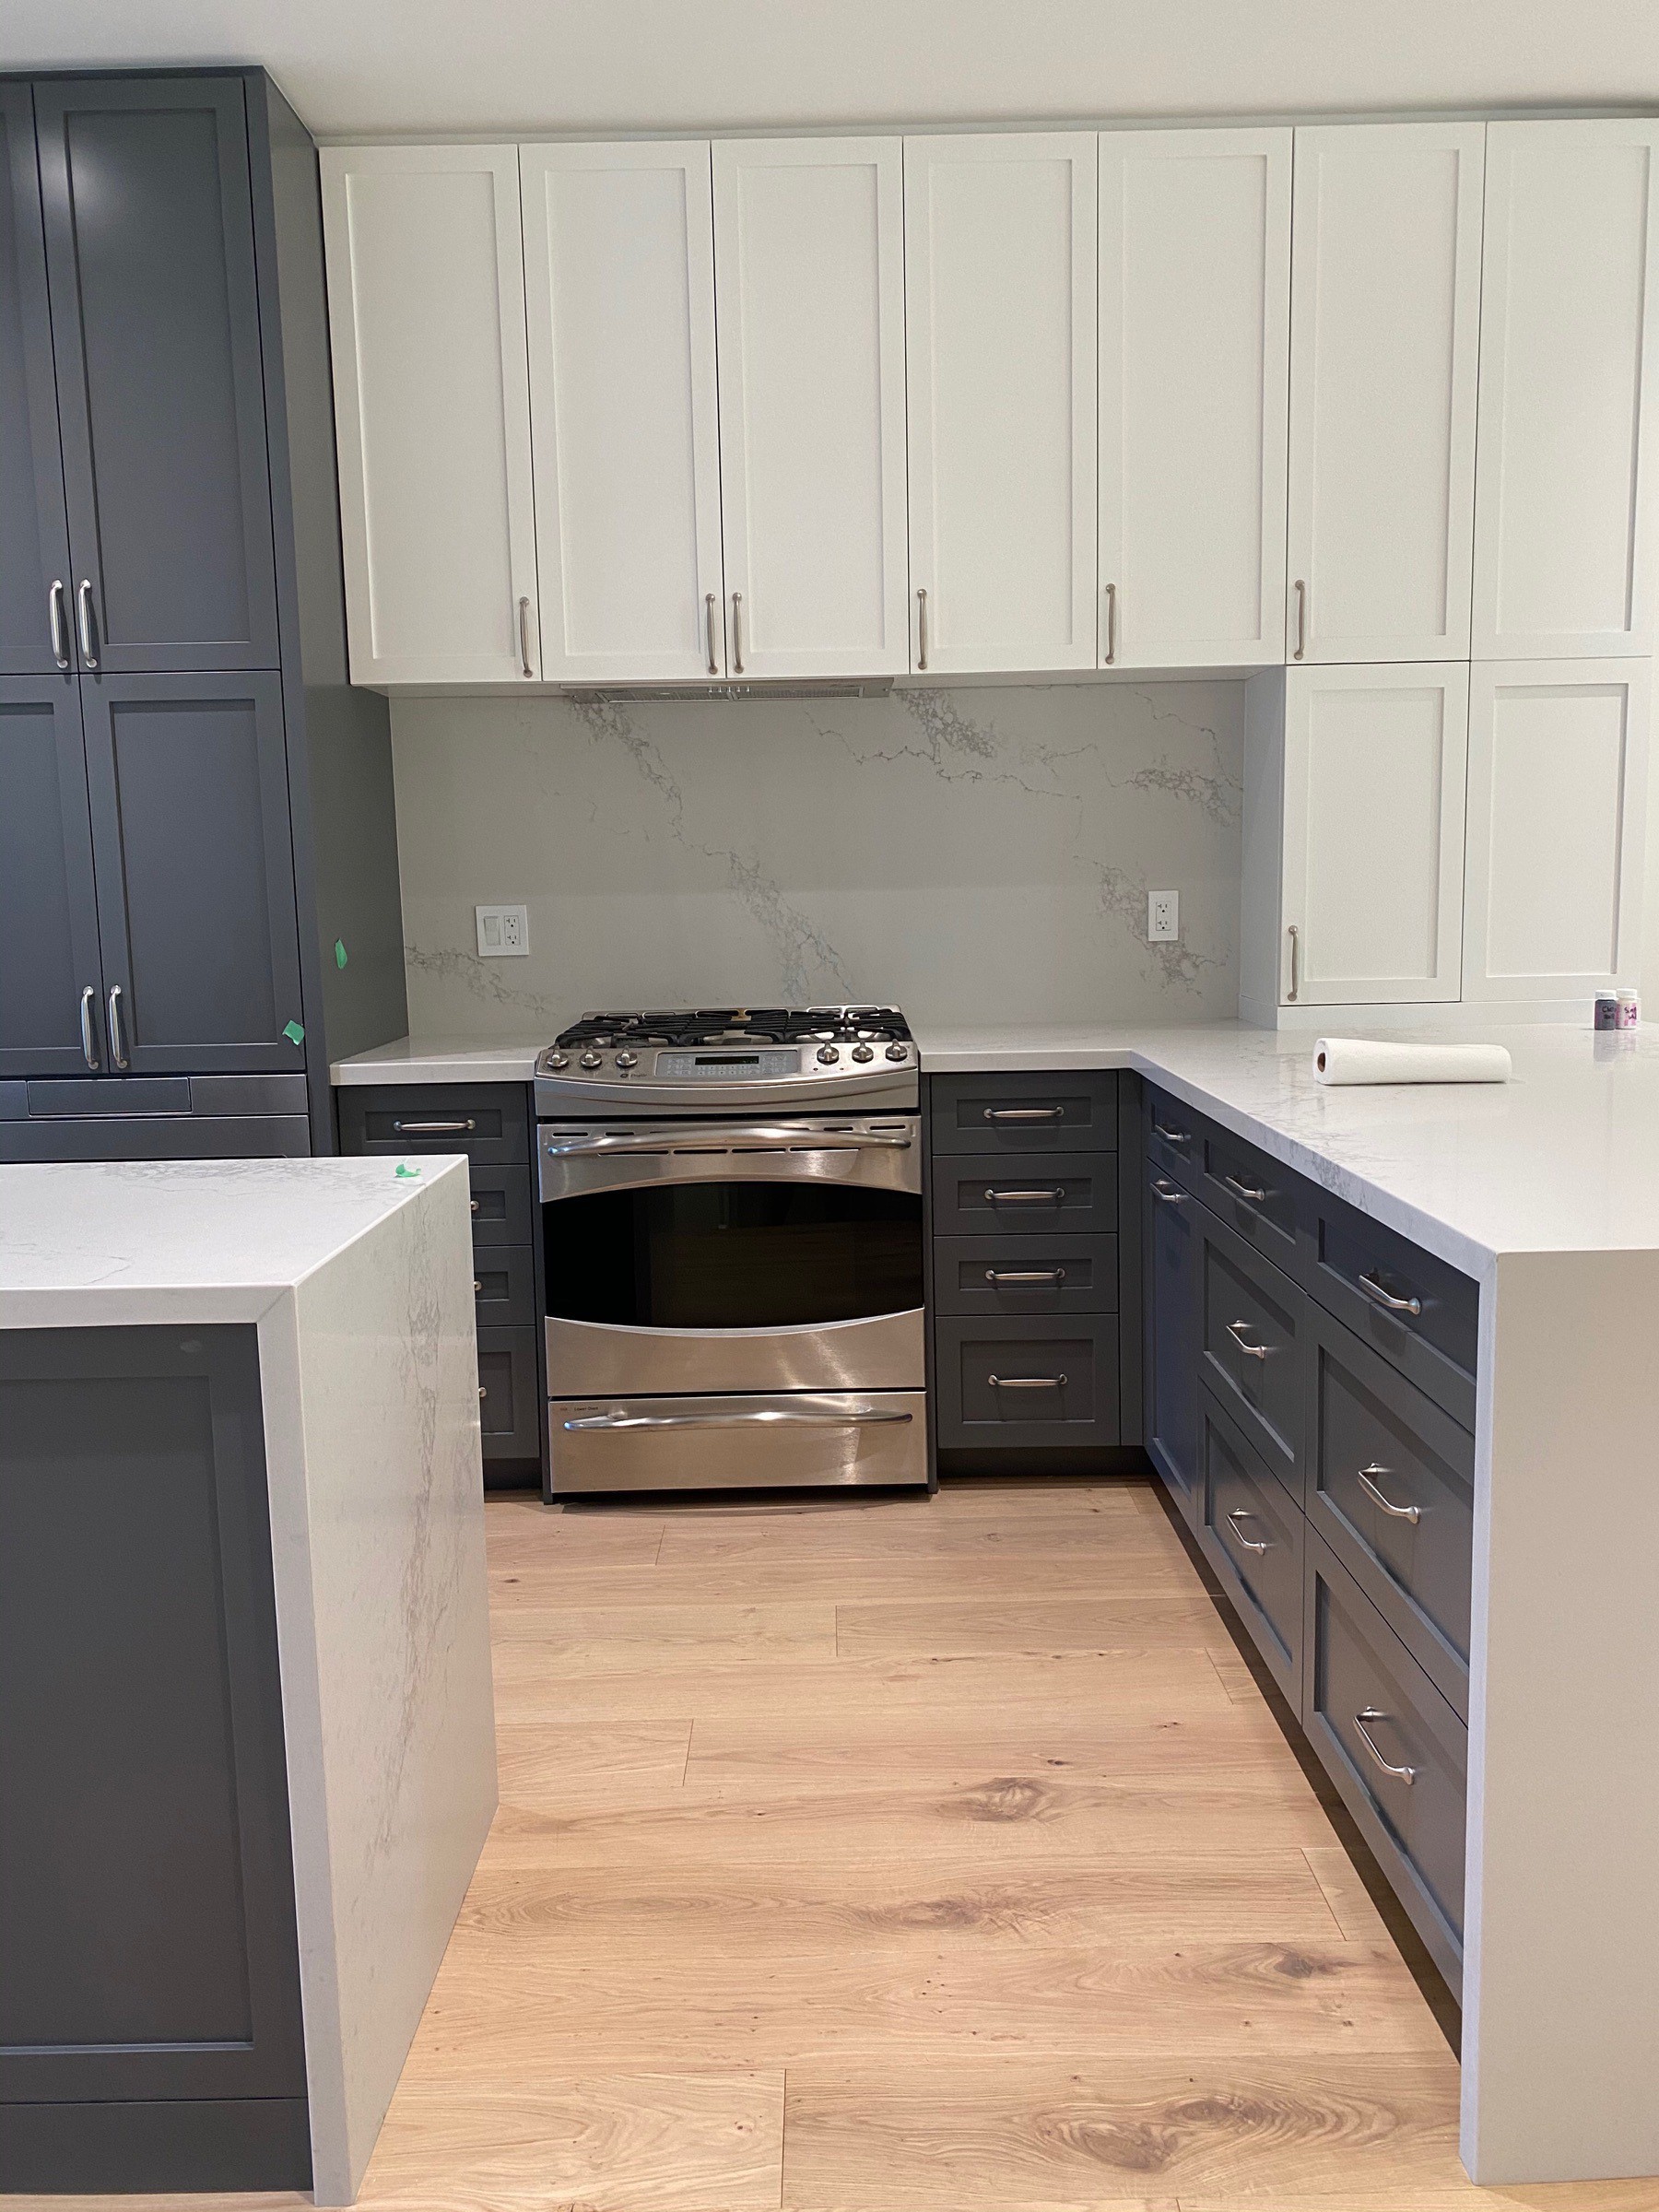
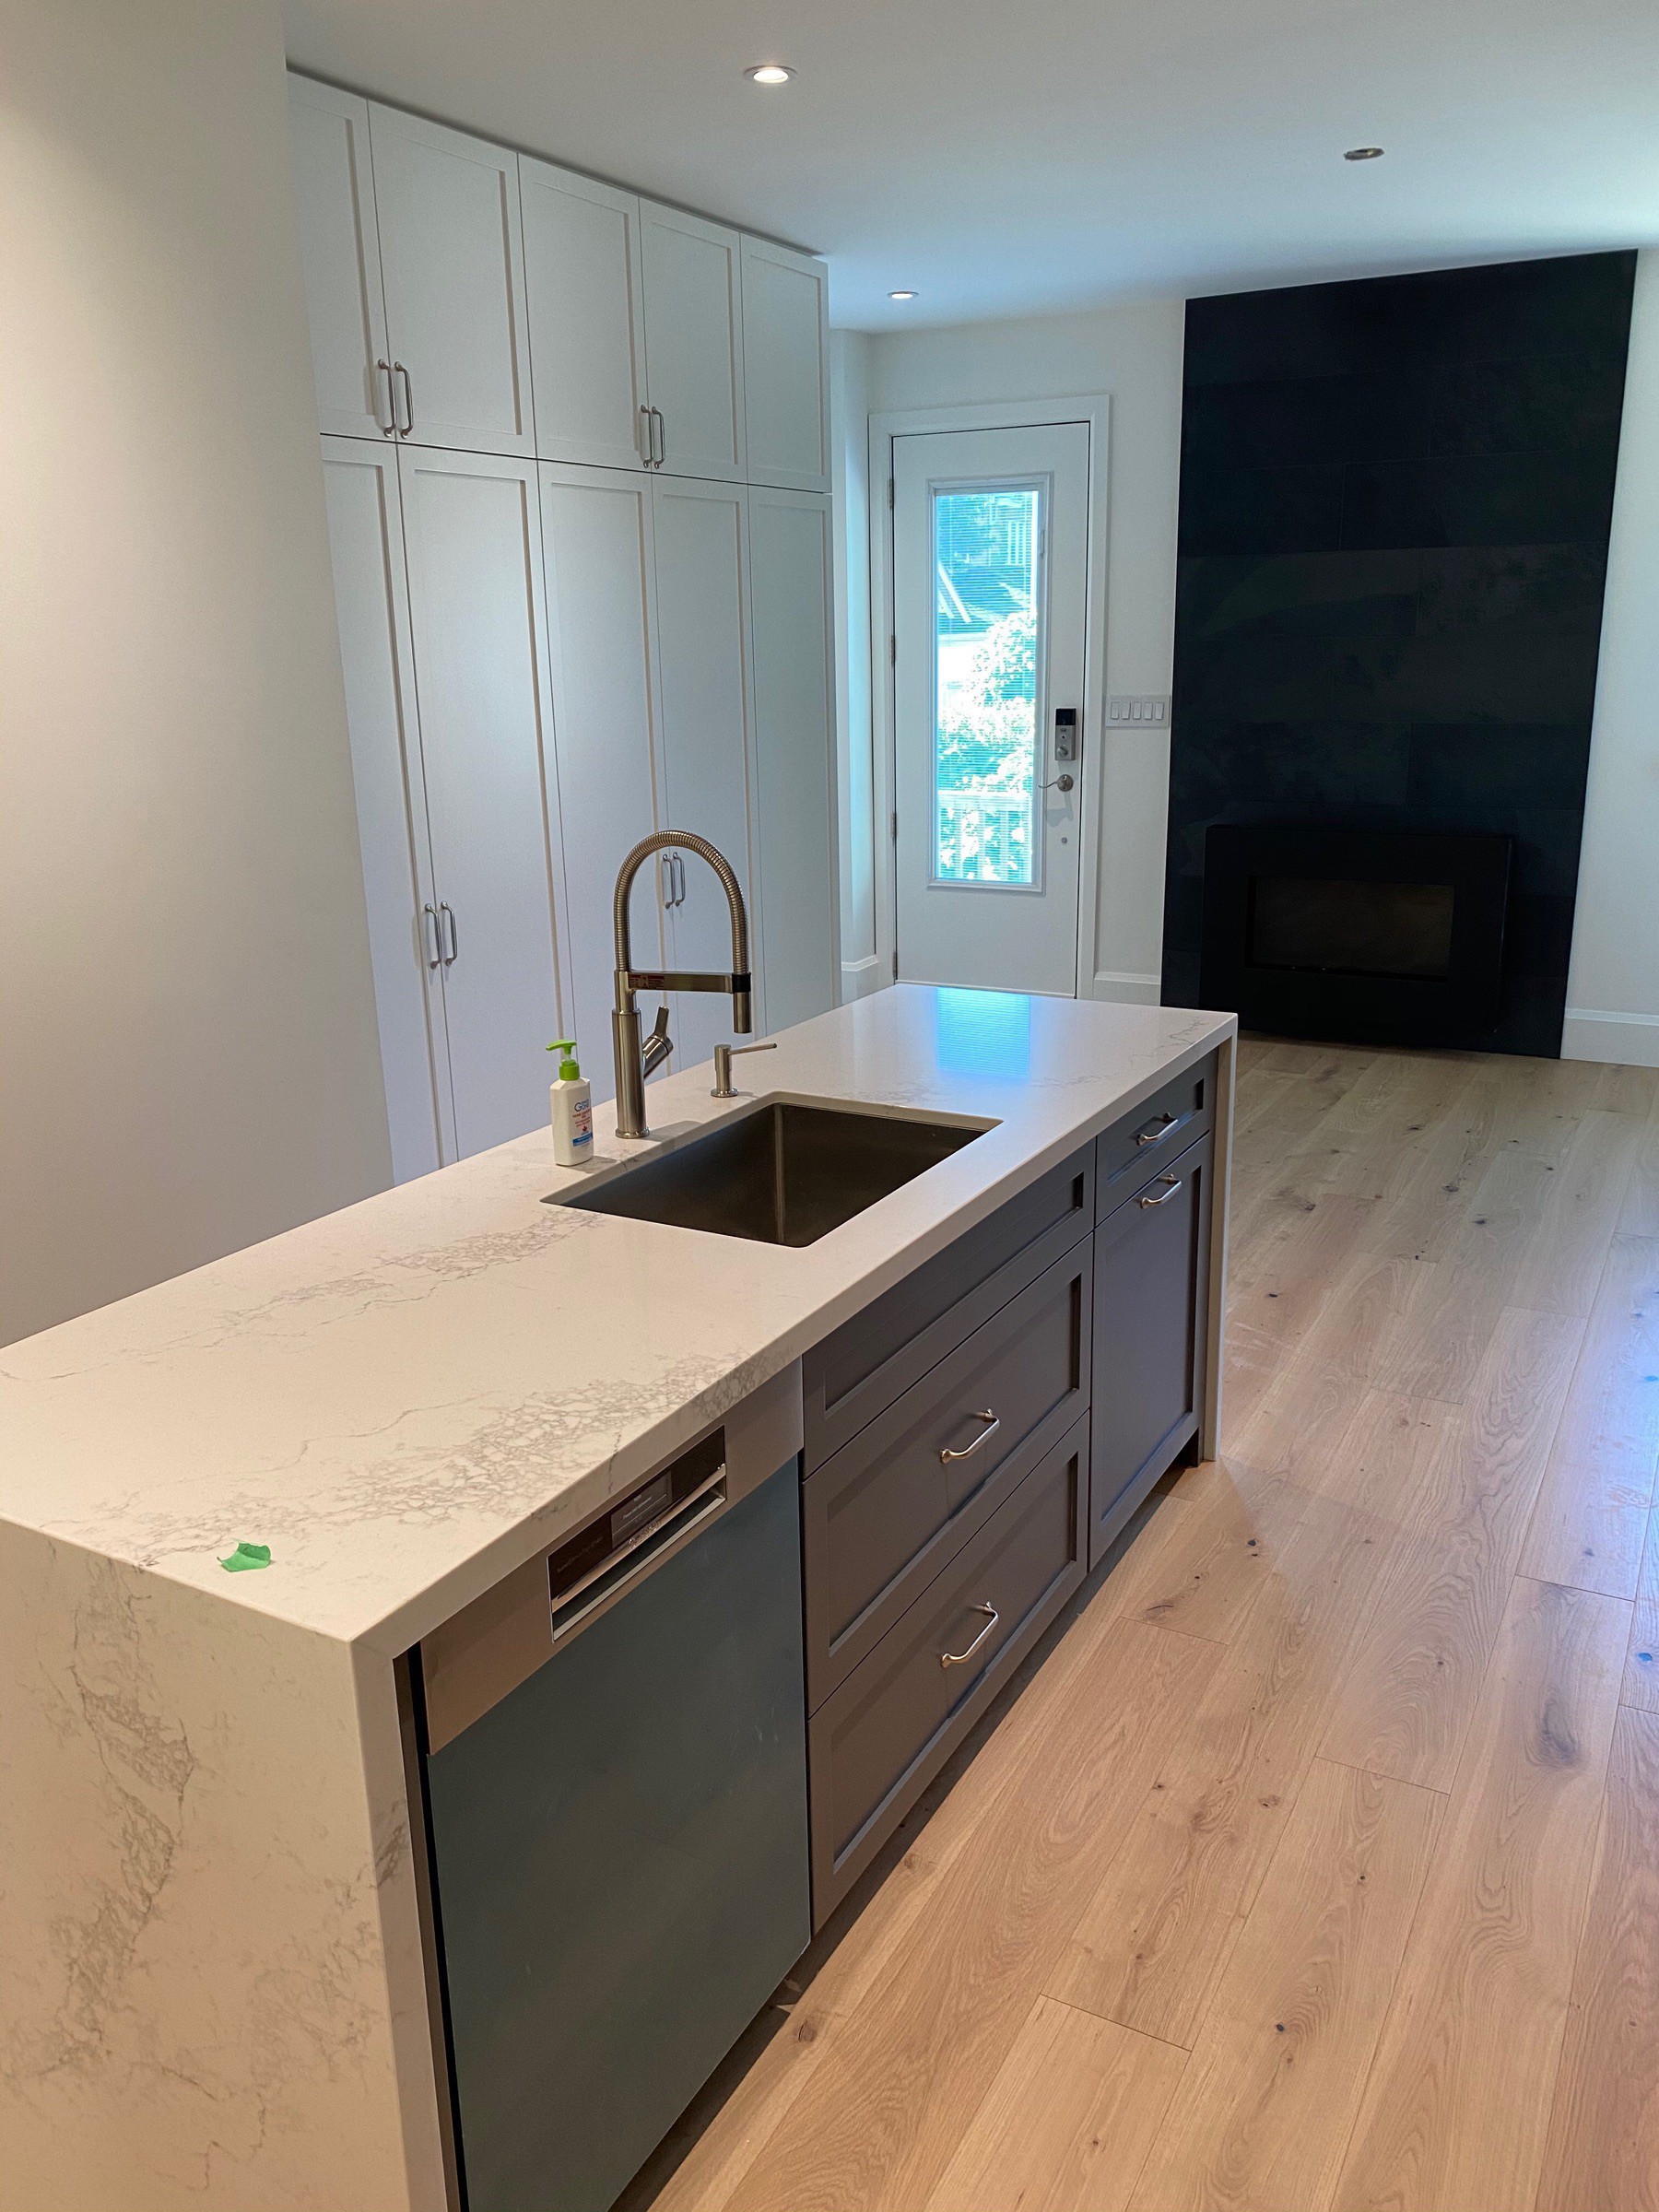
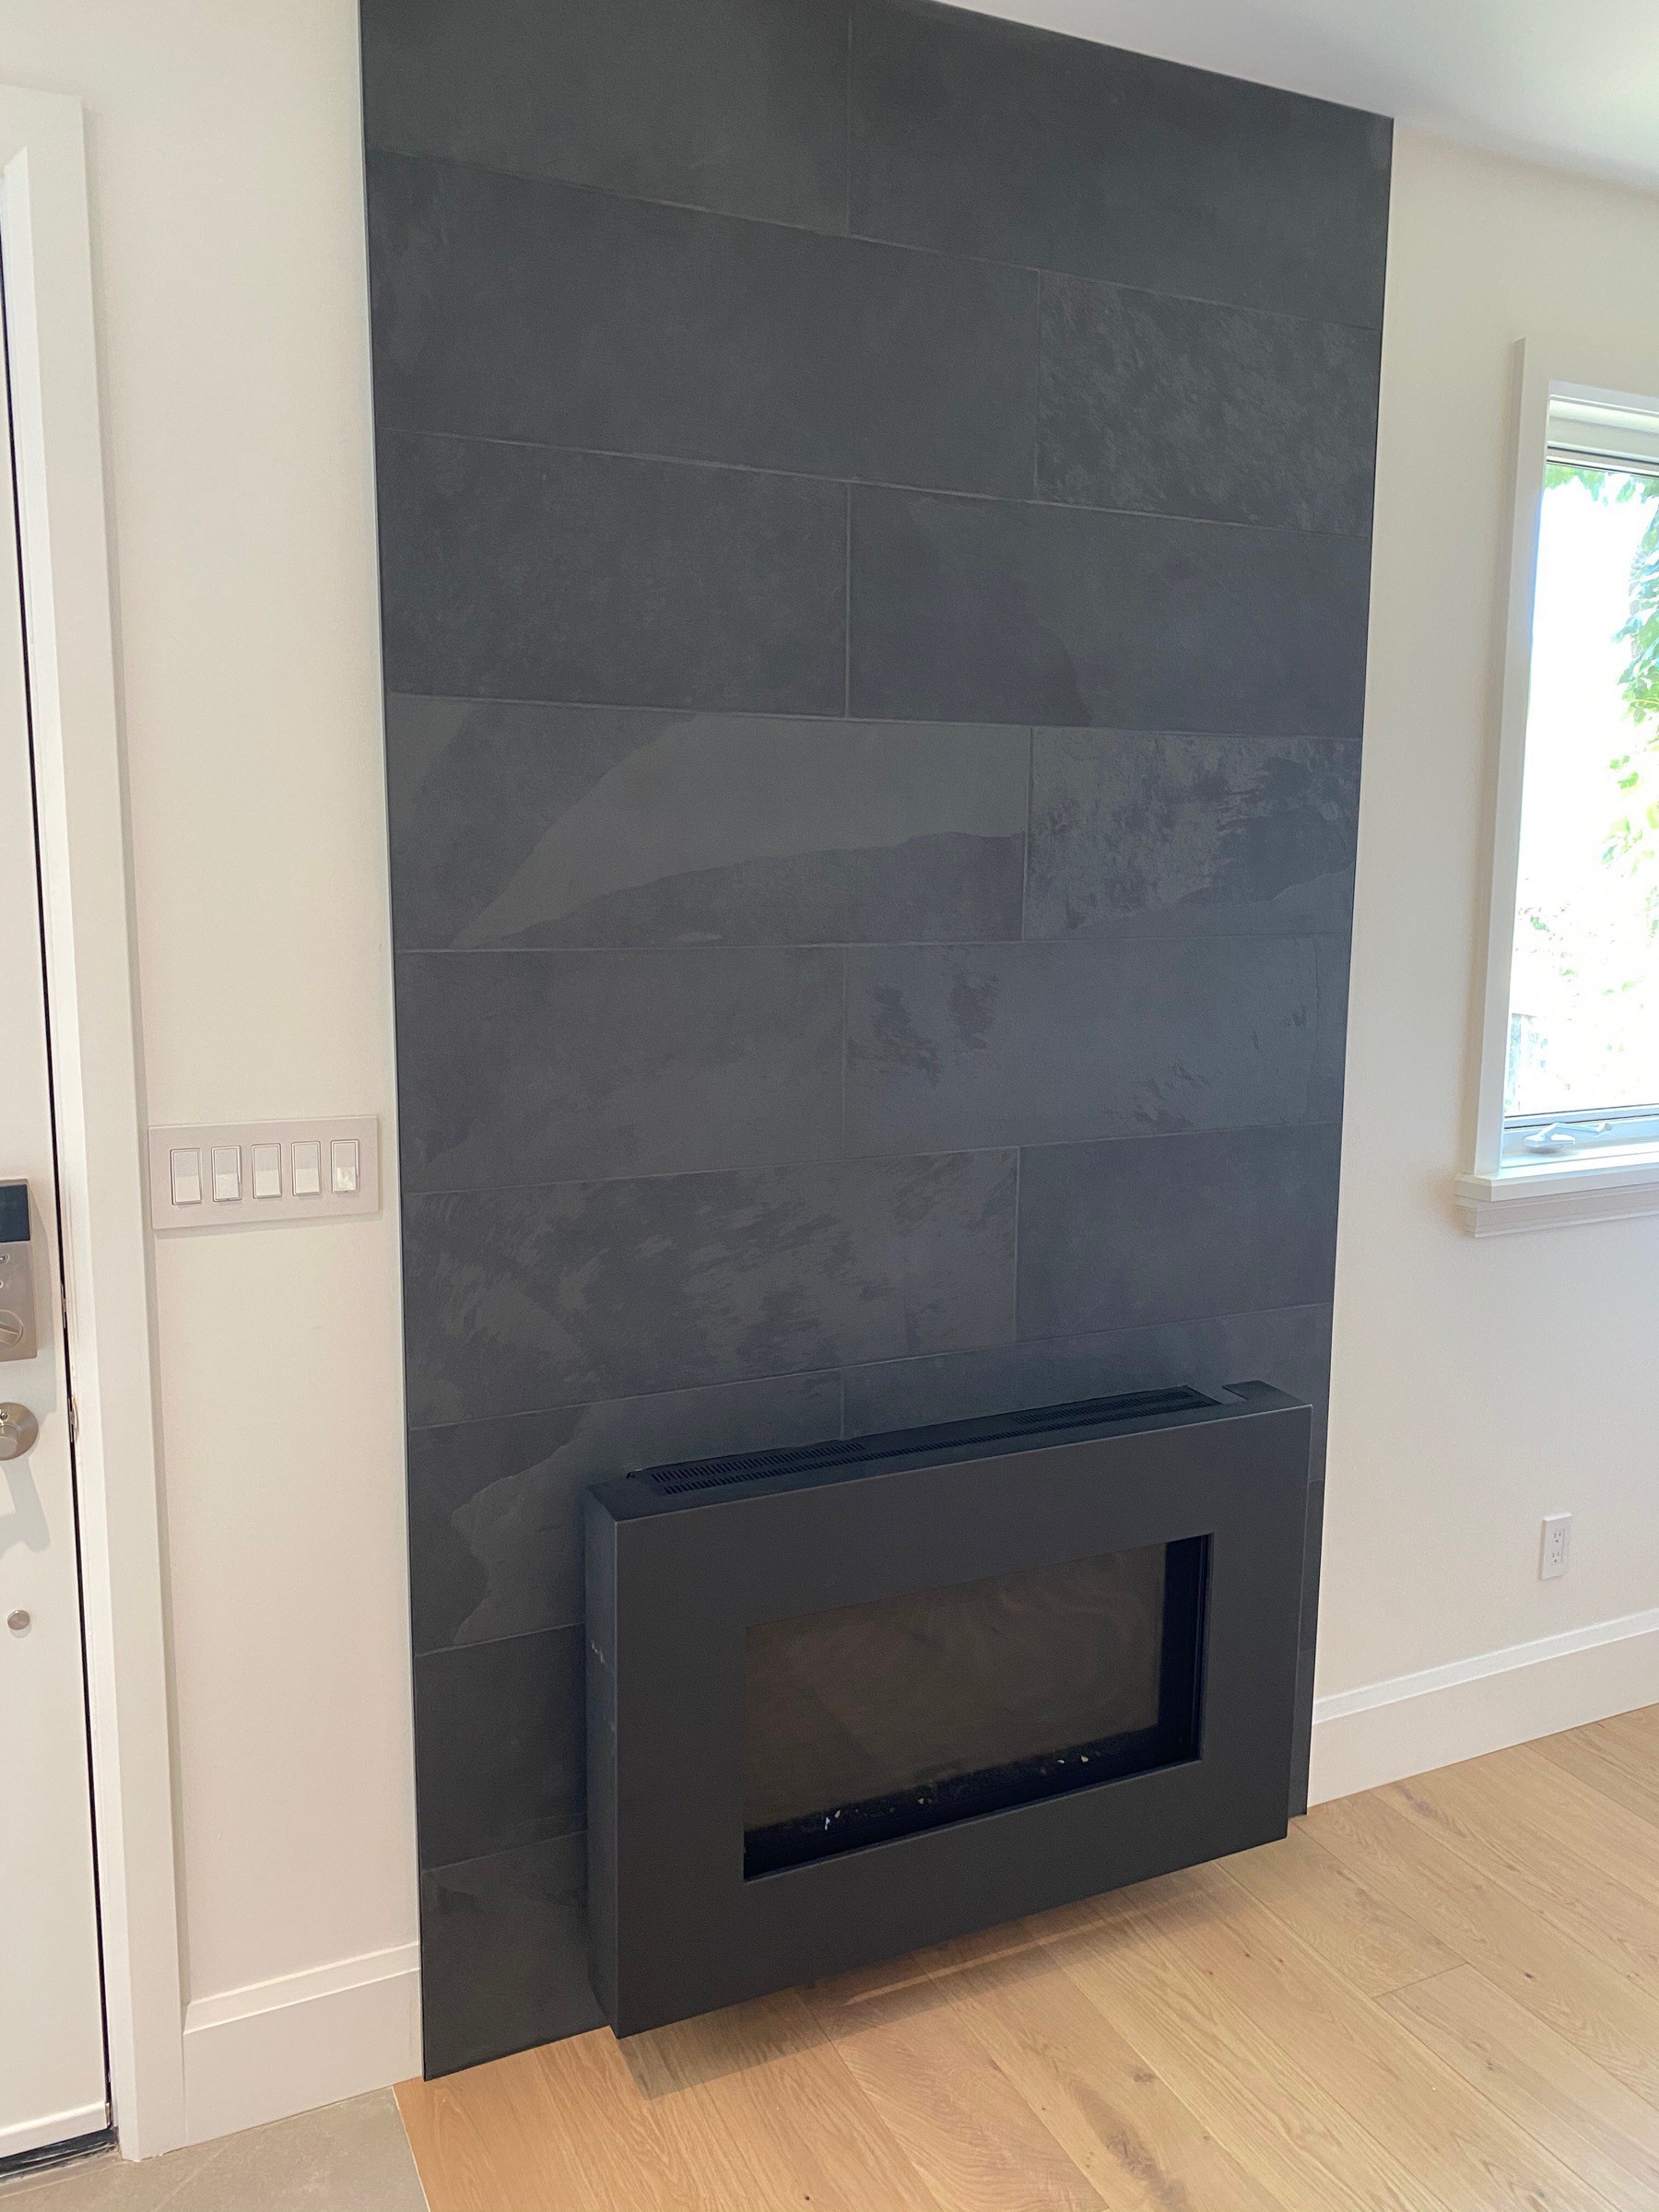
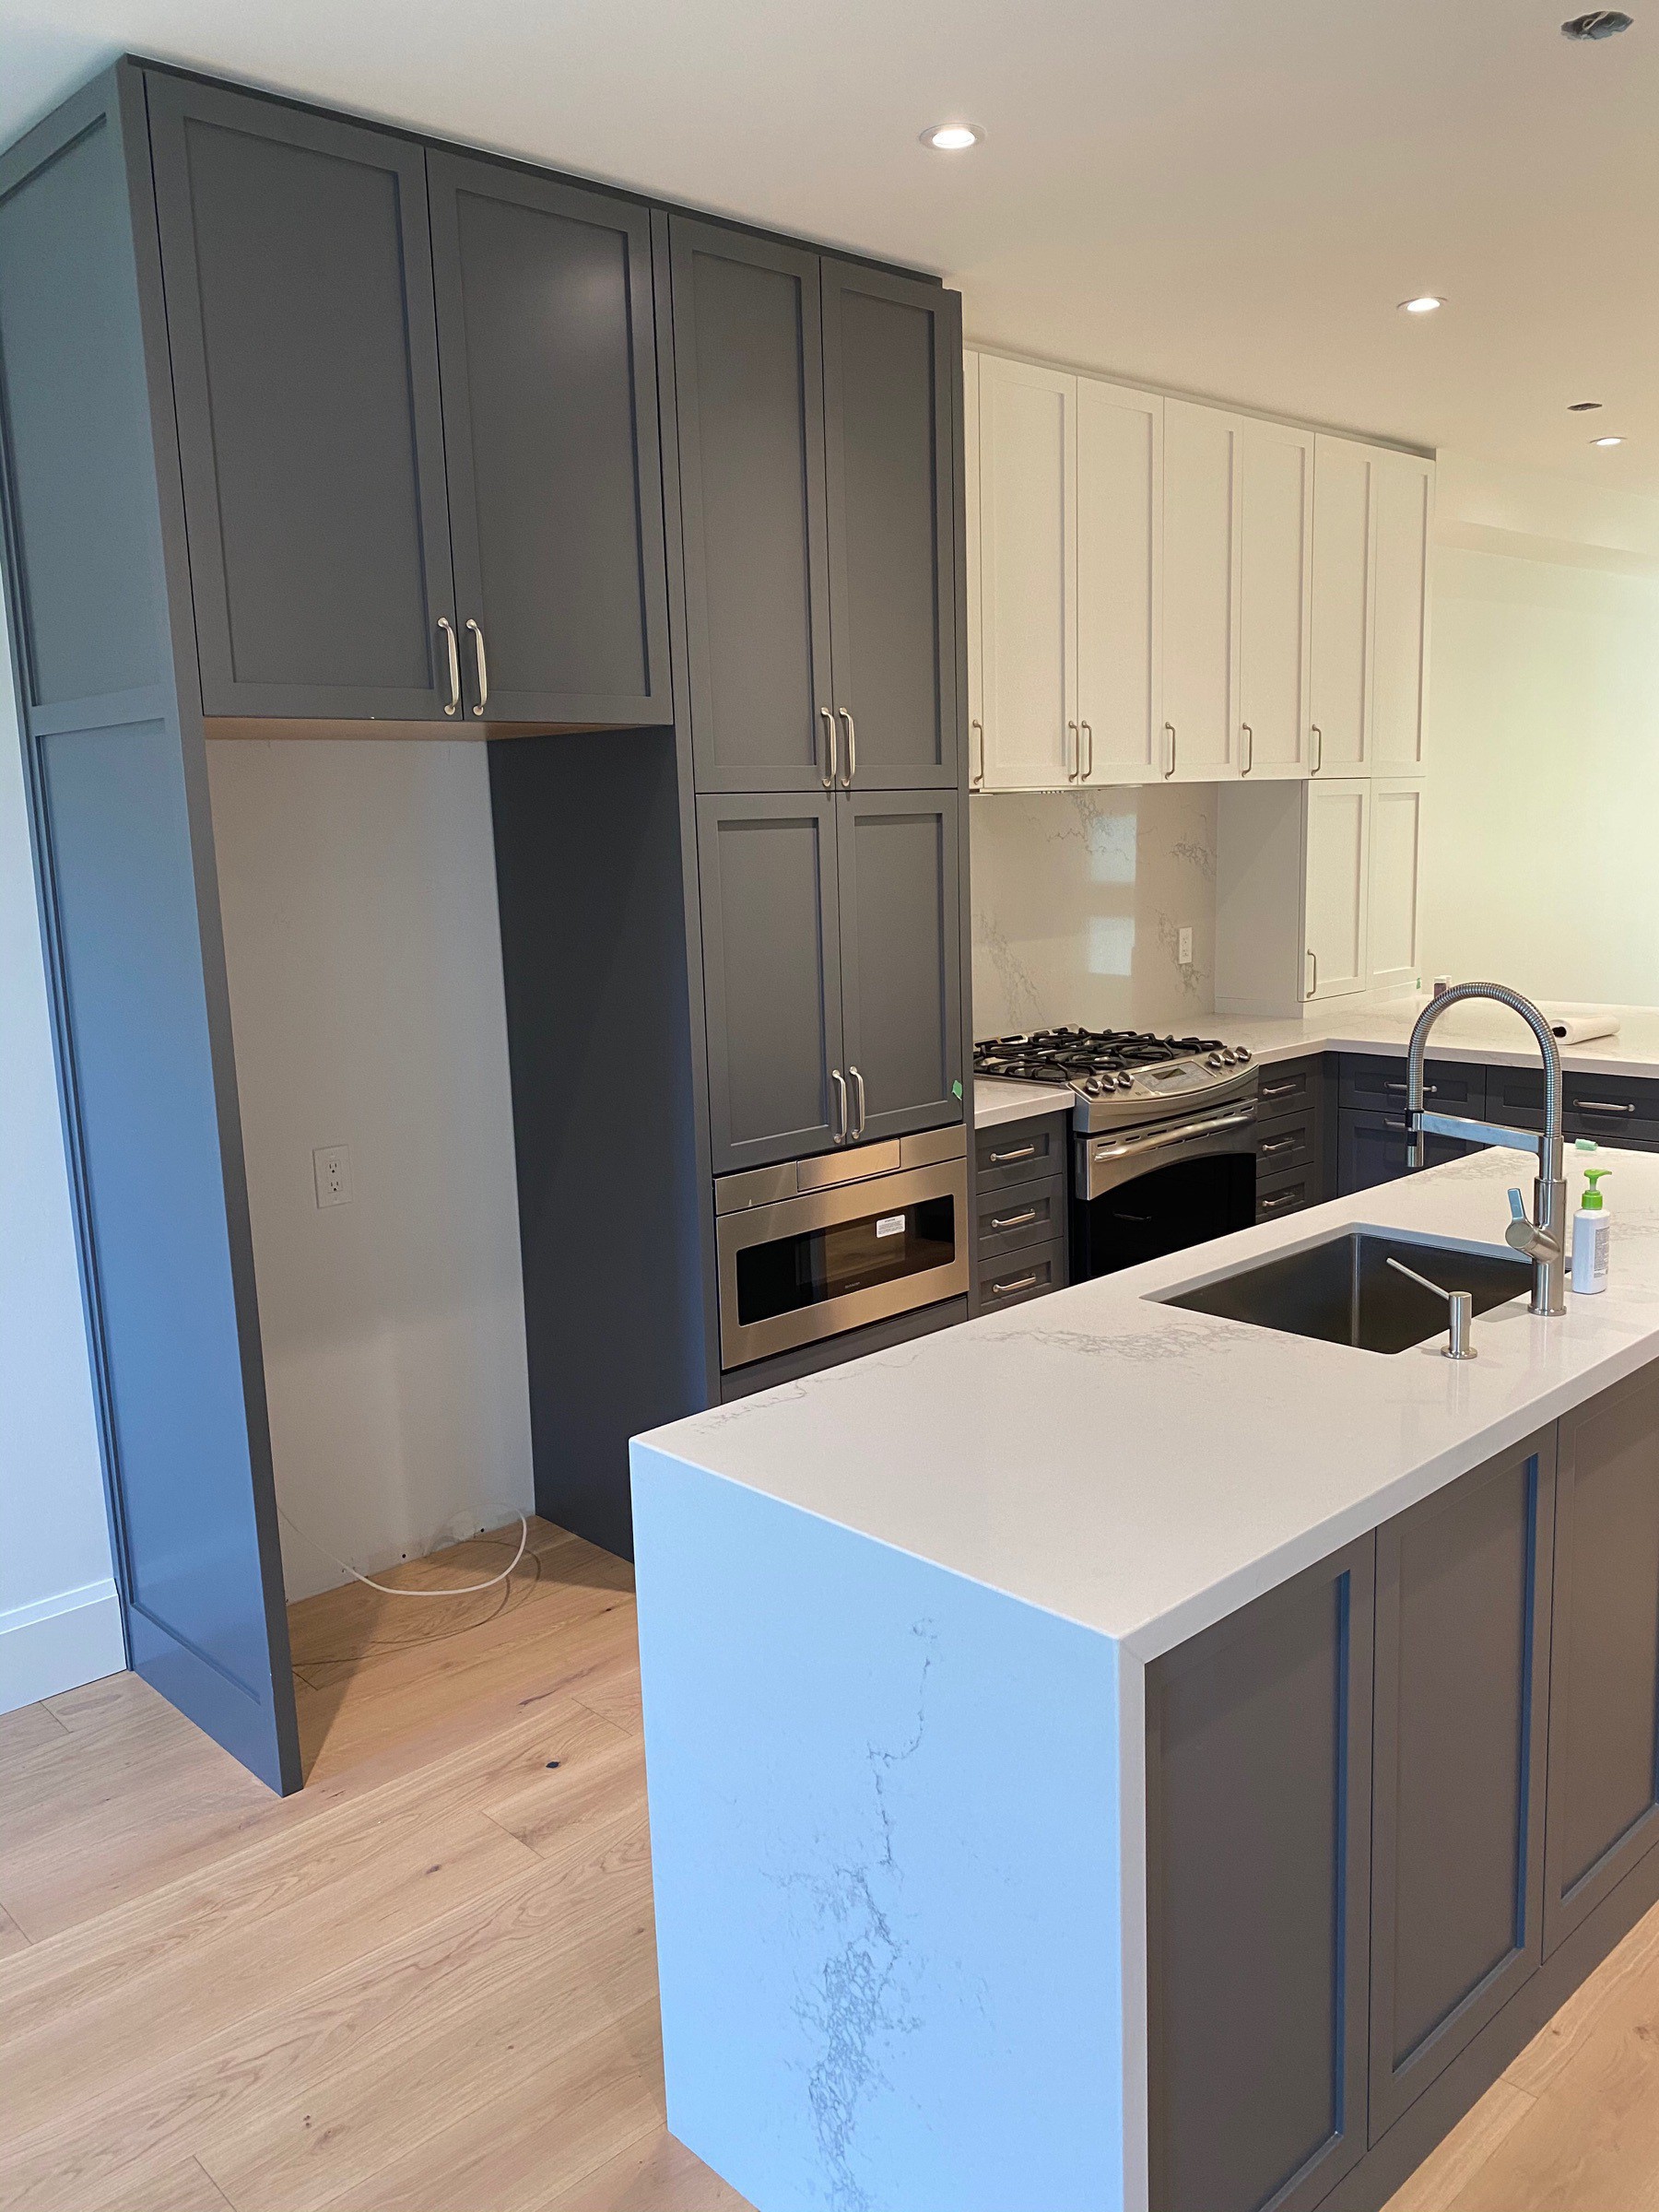
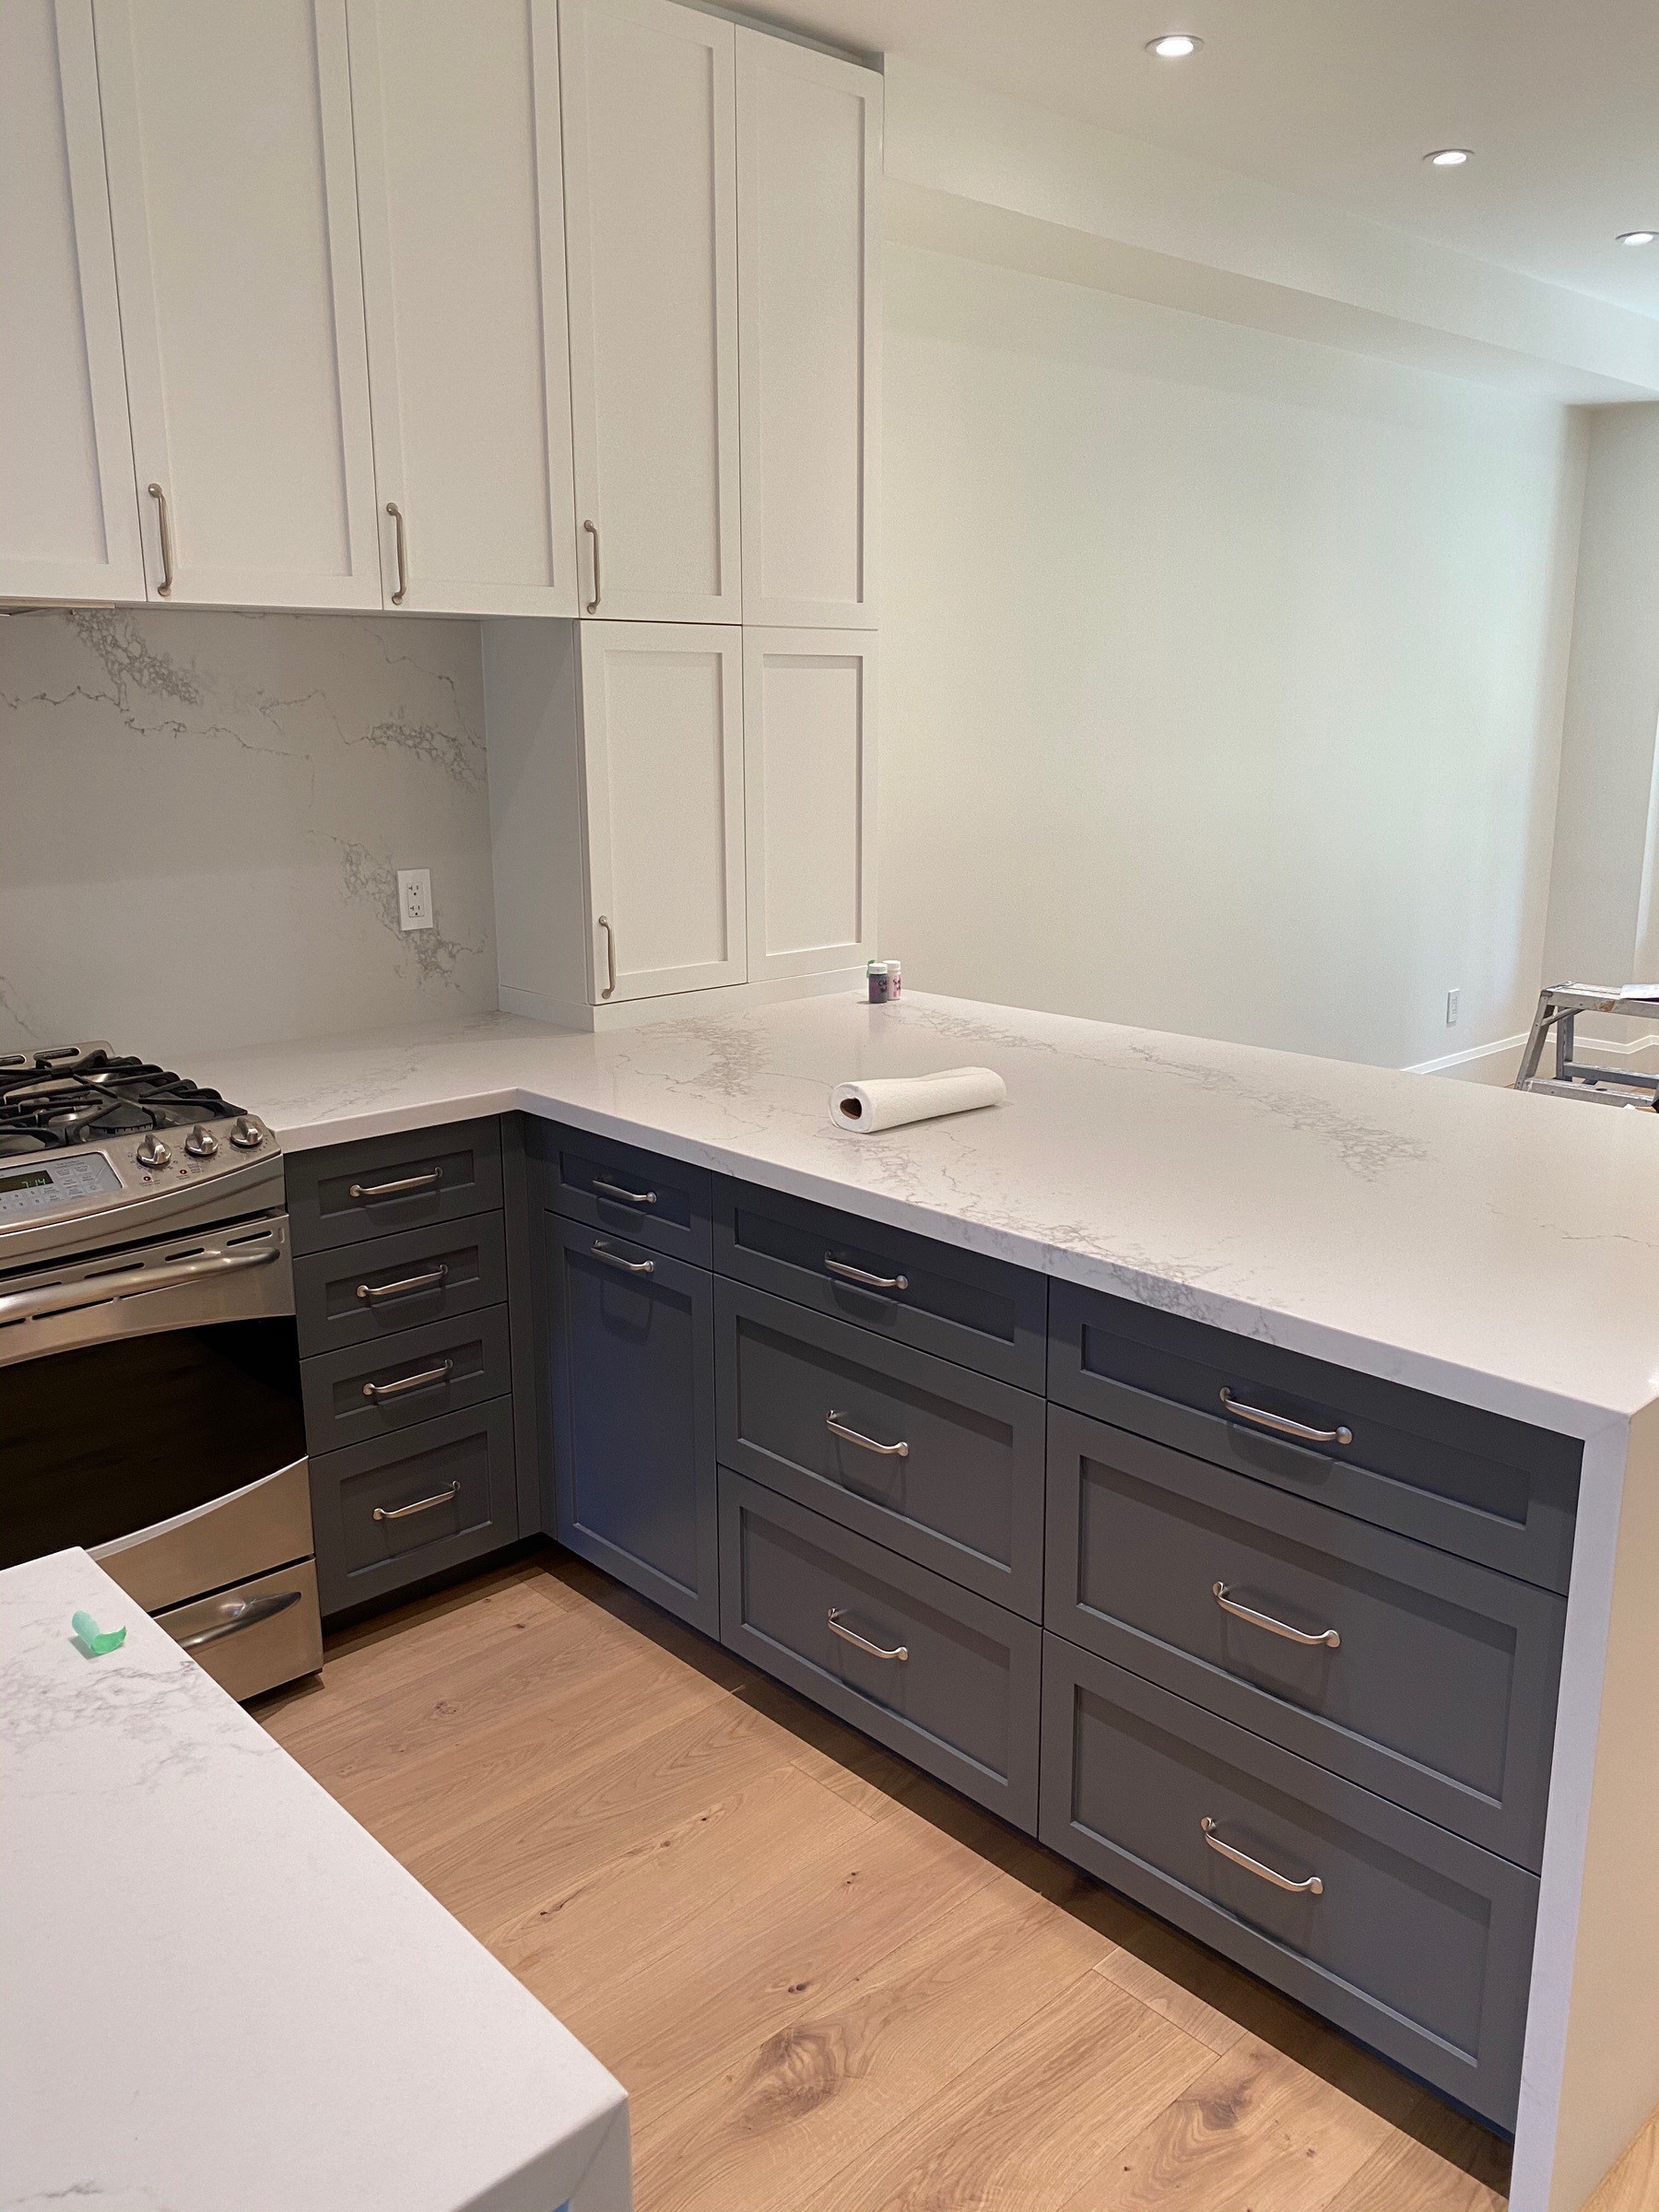
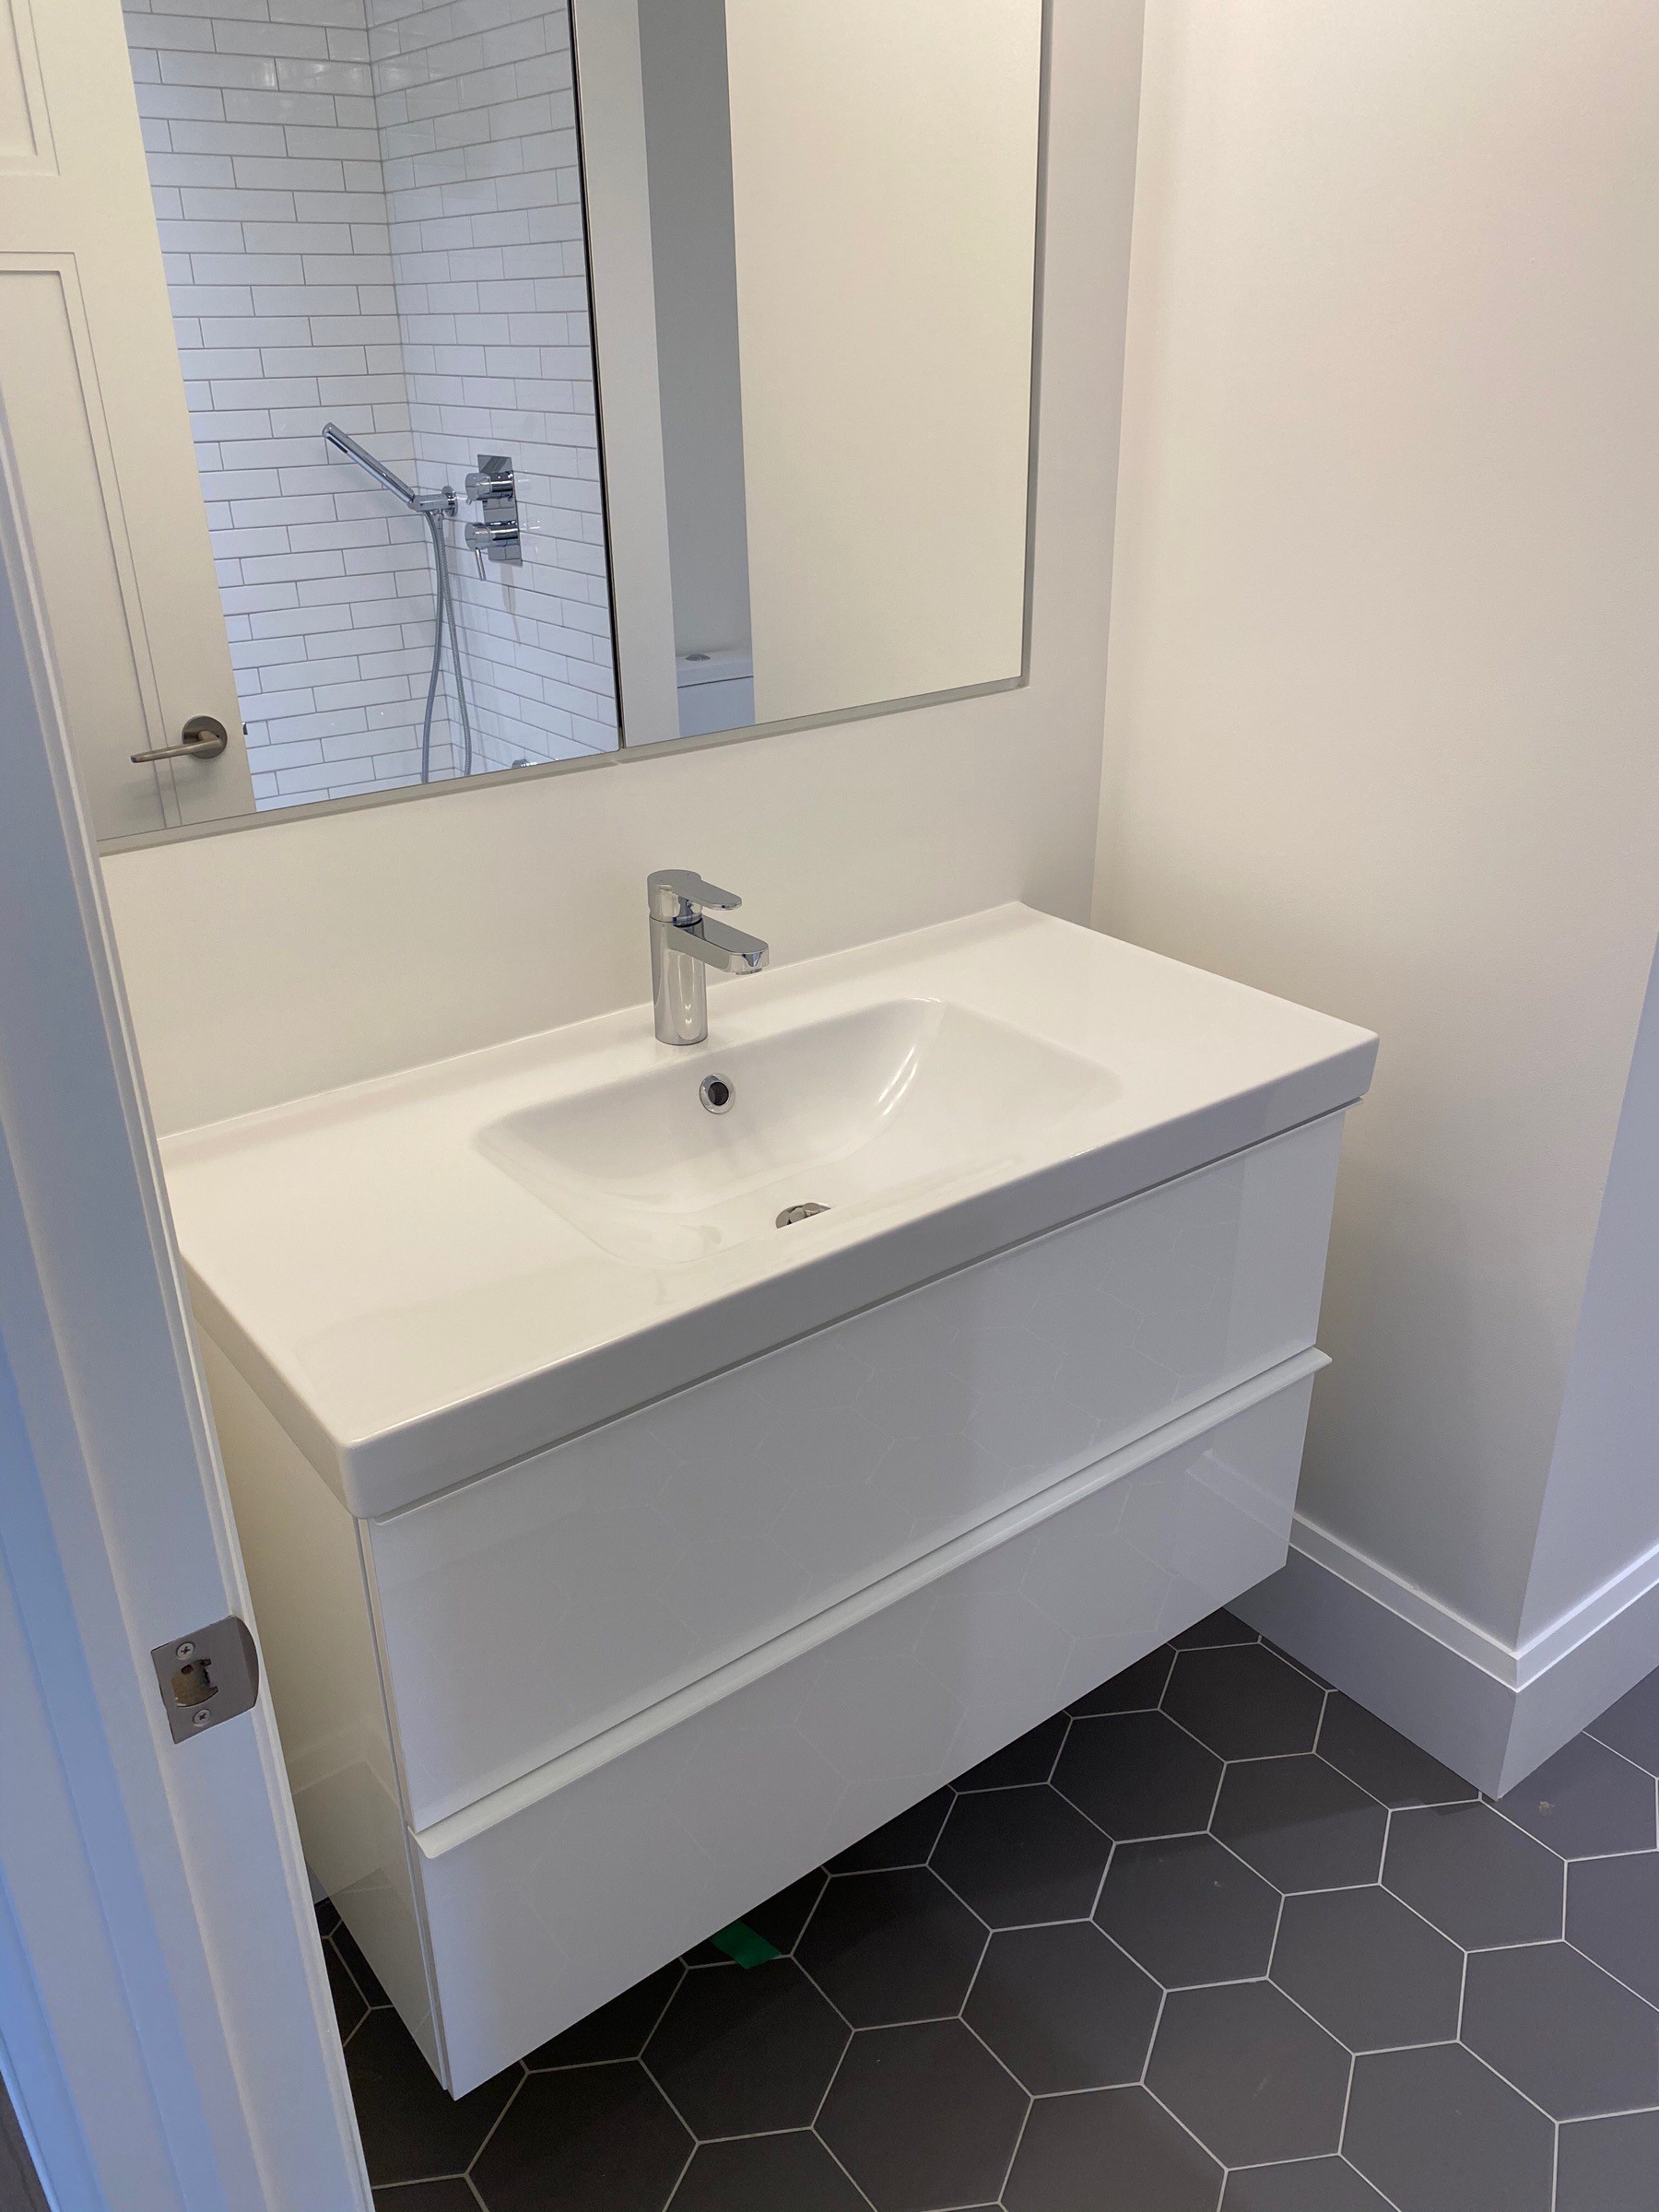
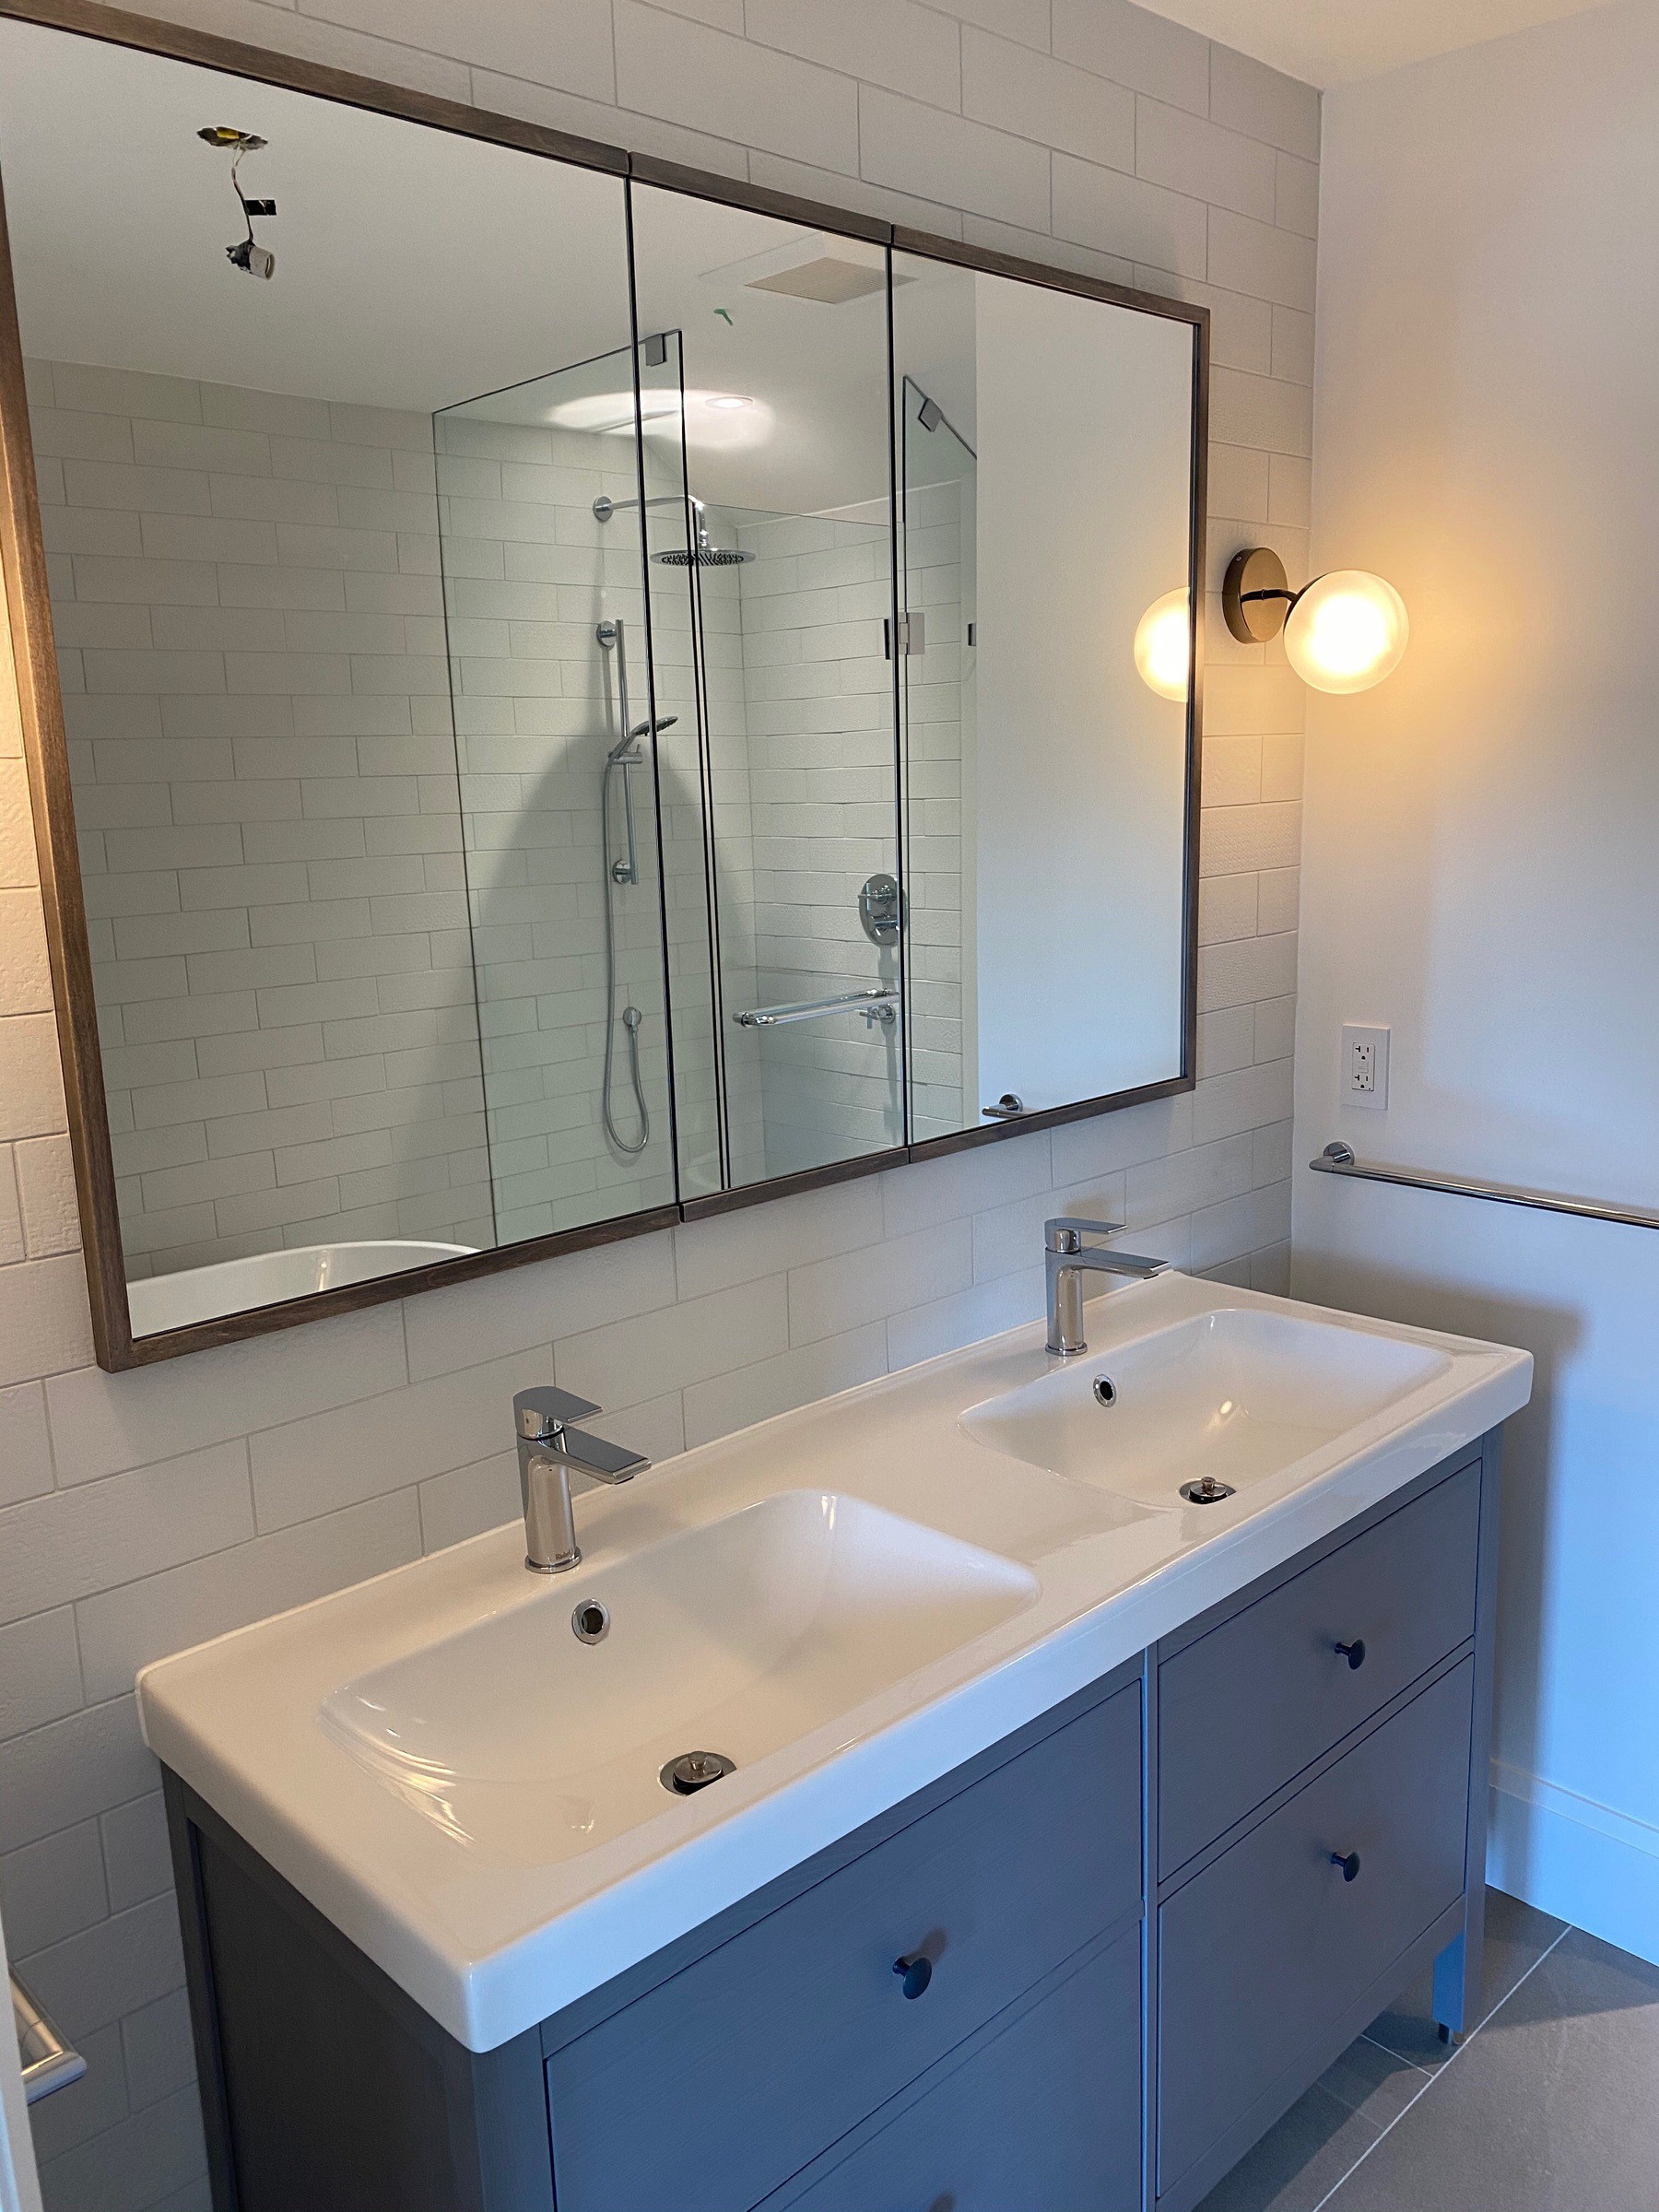
I added a HomePod to the newly renovated house. The sound quality is definitely as good as advertised and I appreciate the Apple Music integration 🎶. Siri has worked just fine for me so far, though I only really use it for reminders and calendar events.
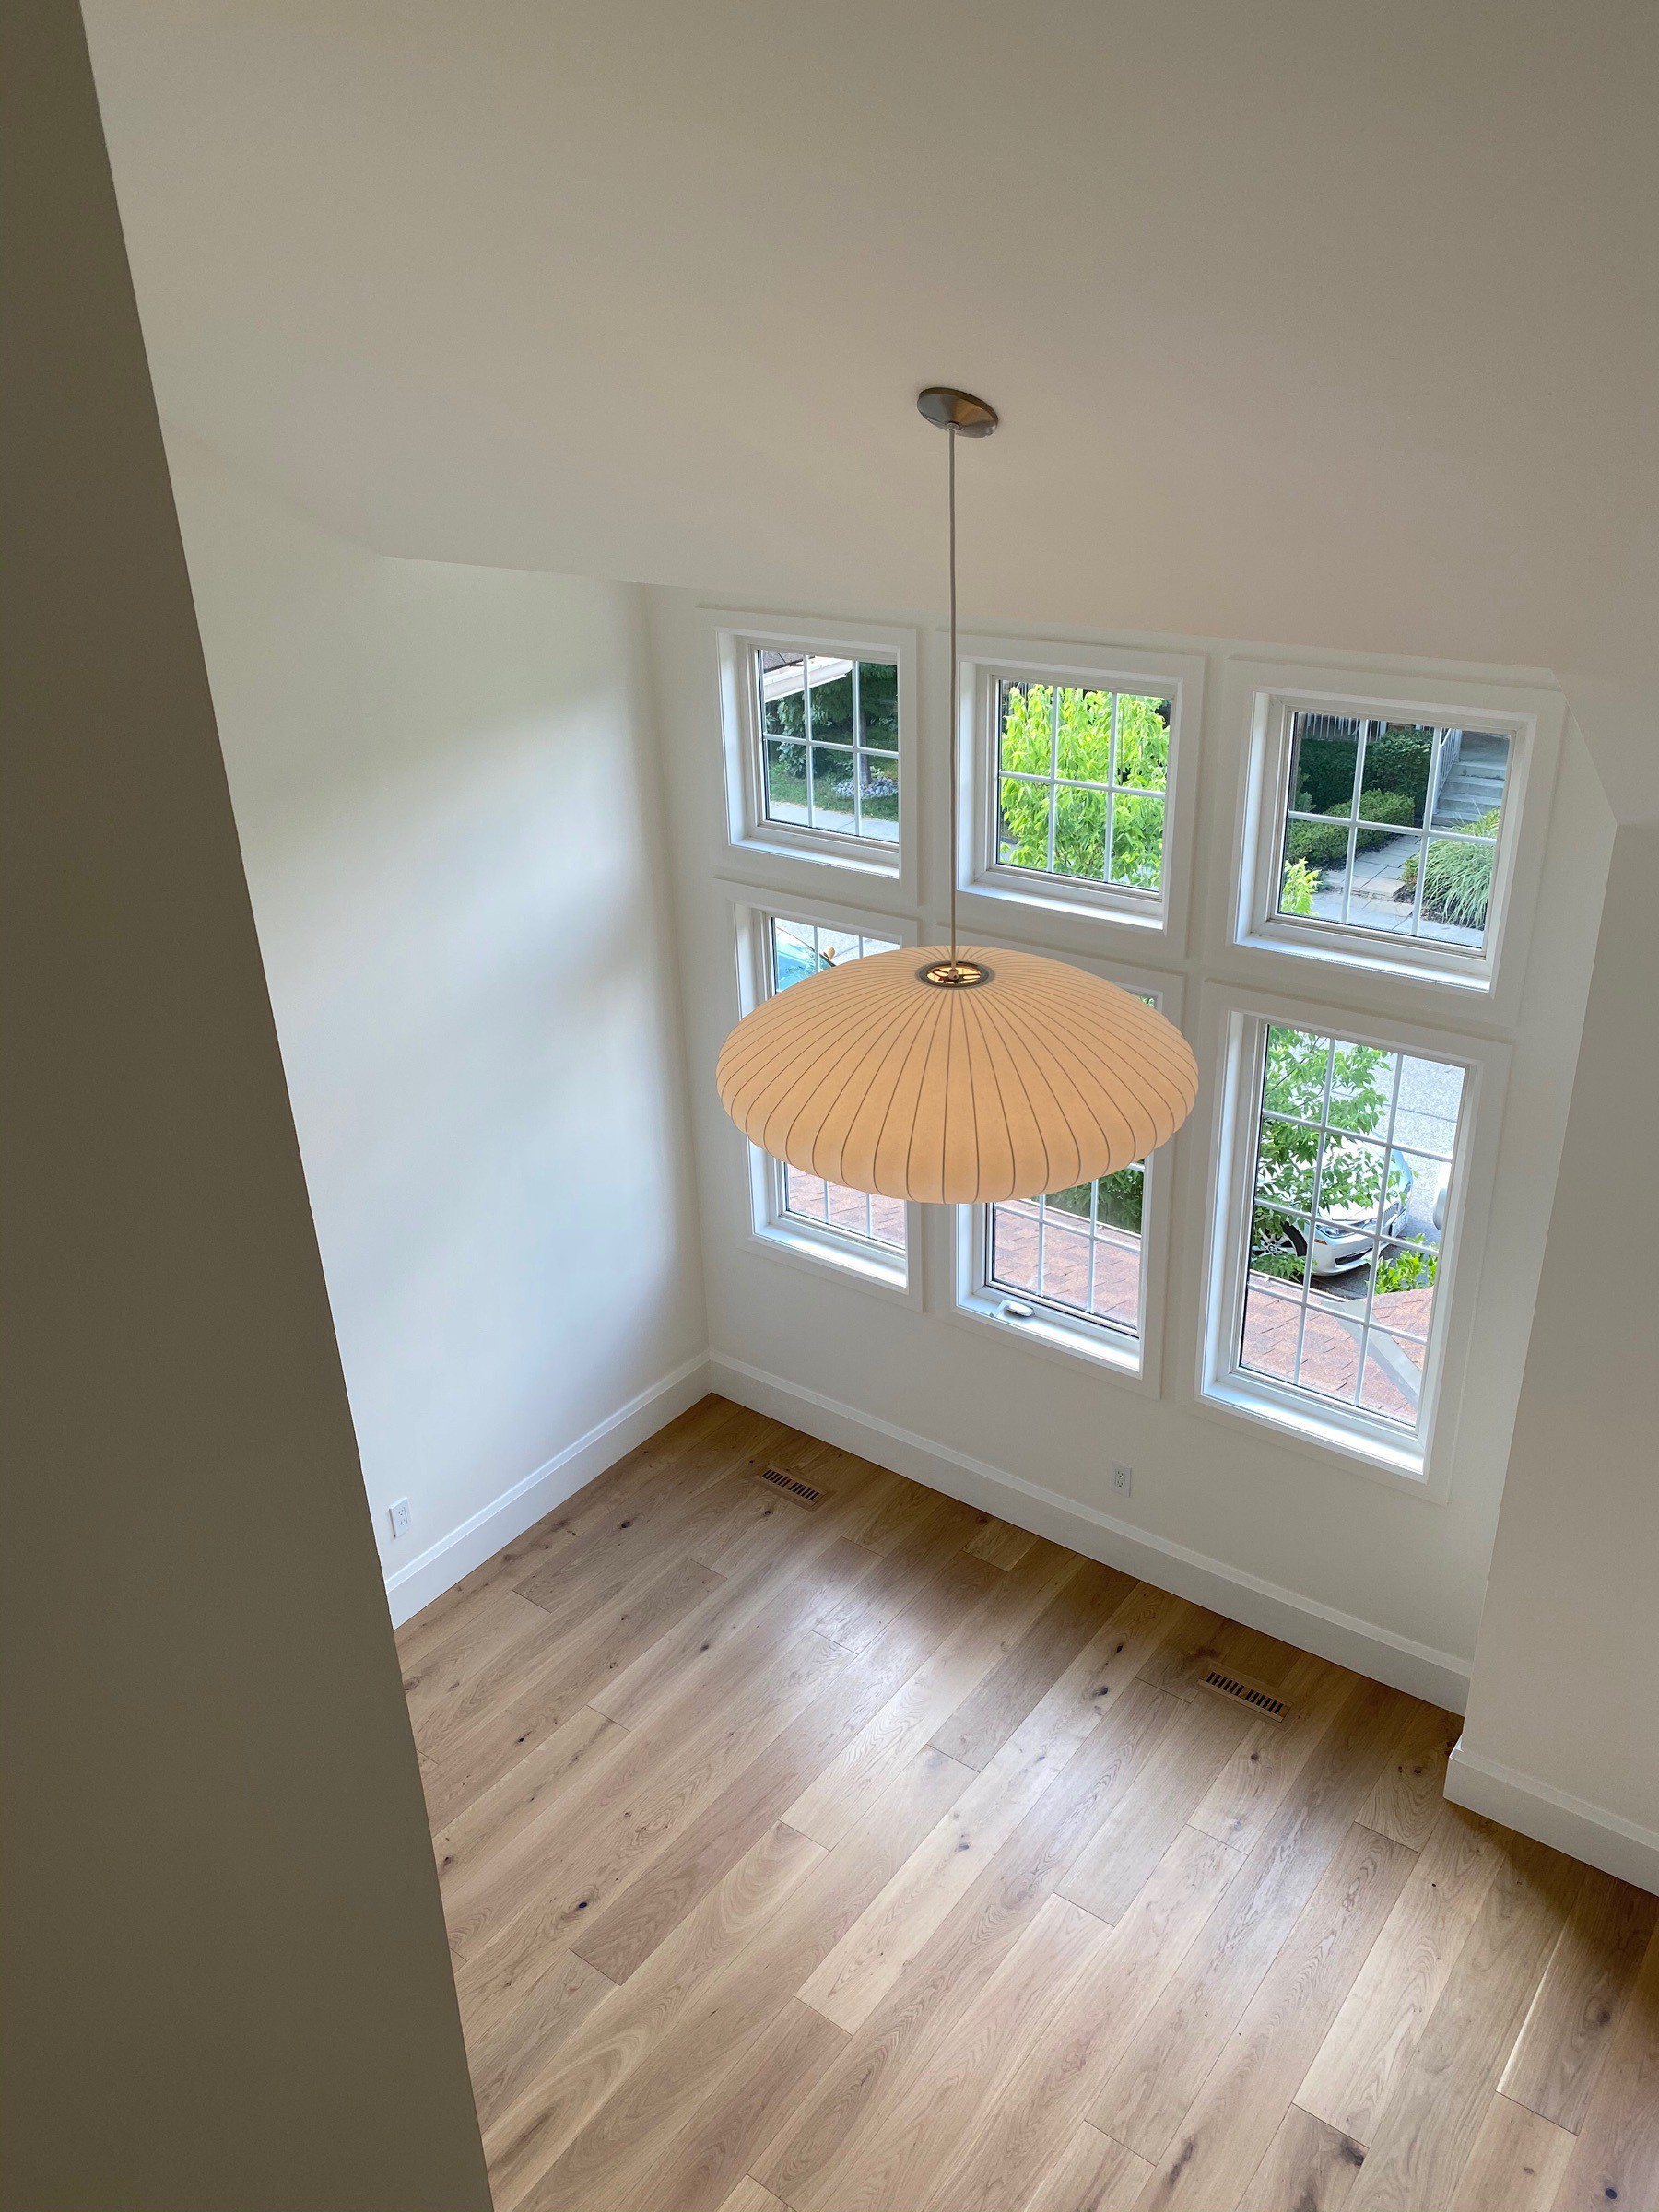
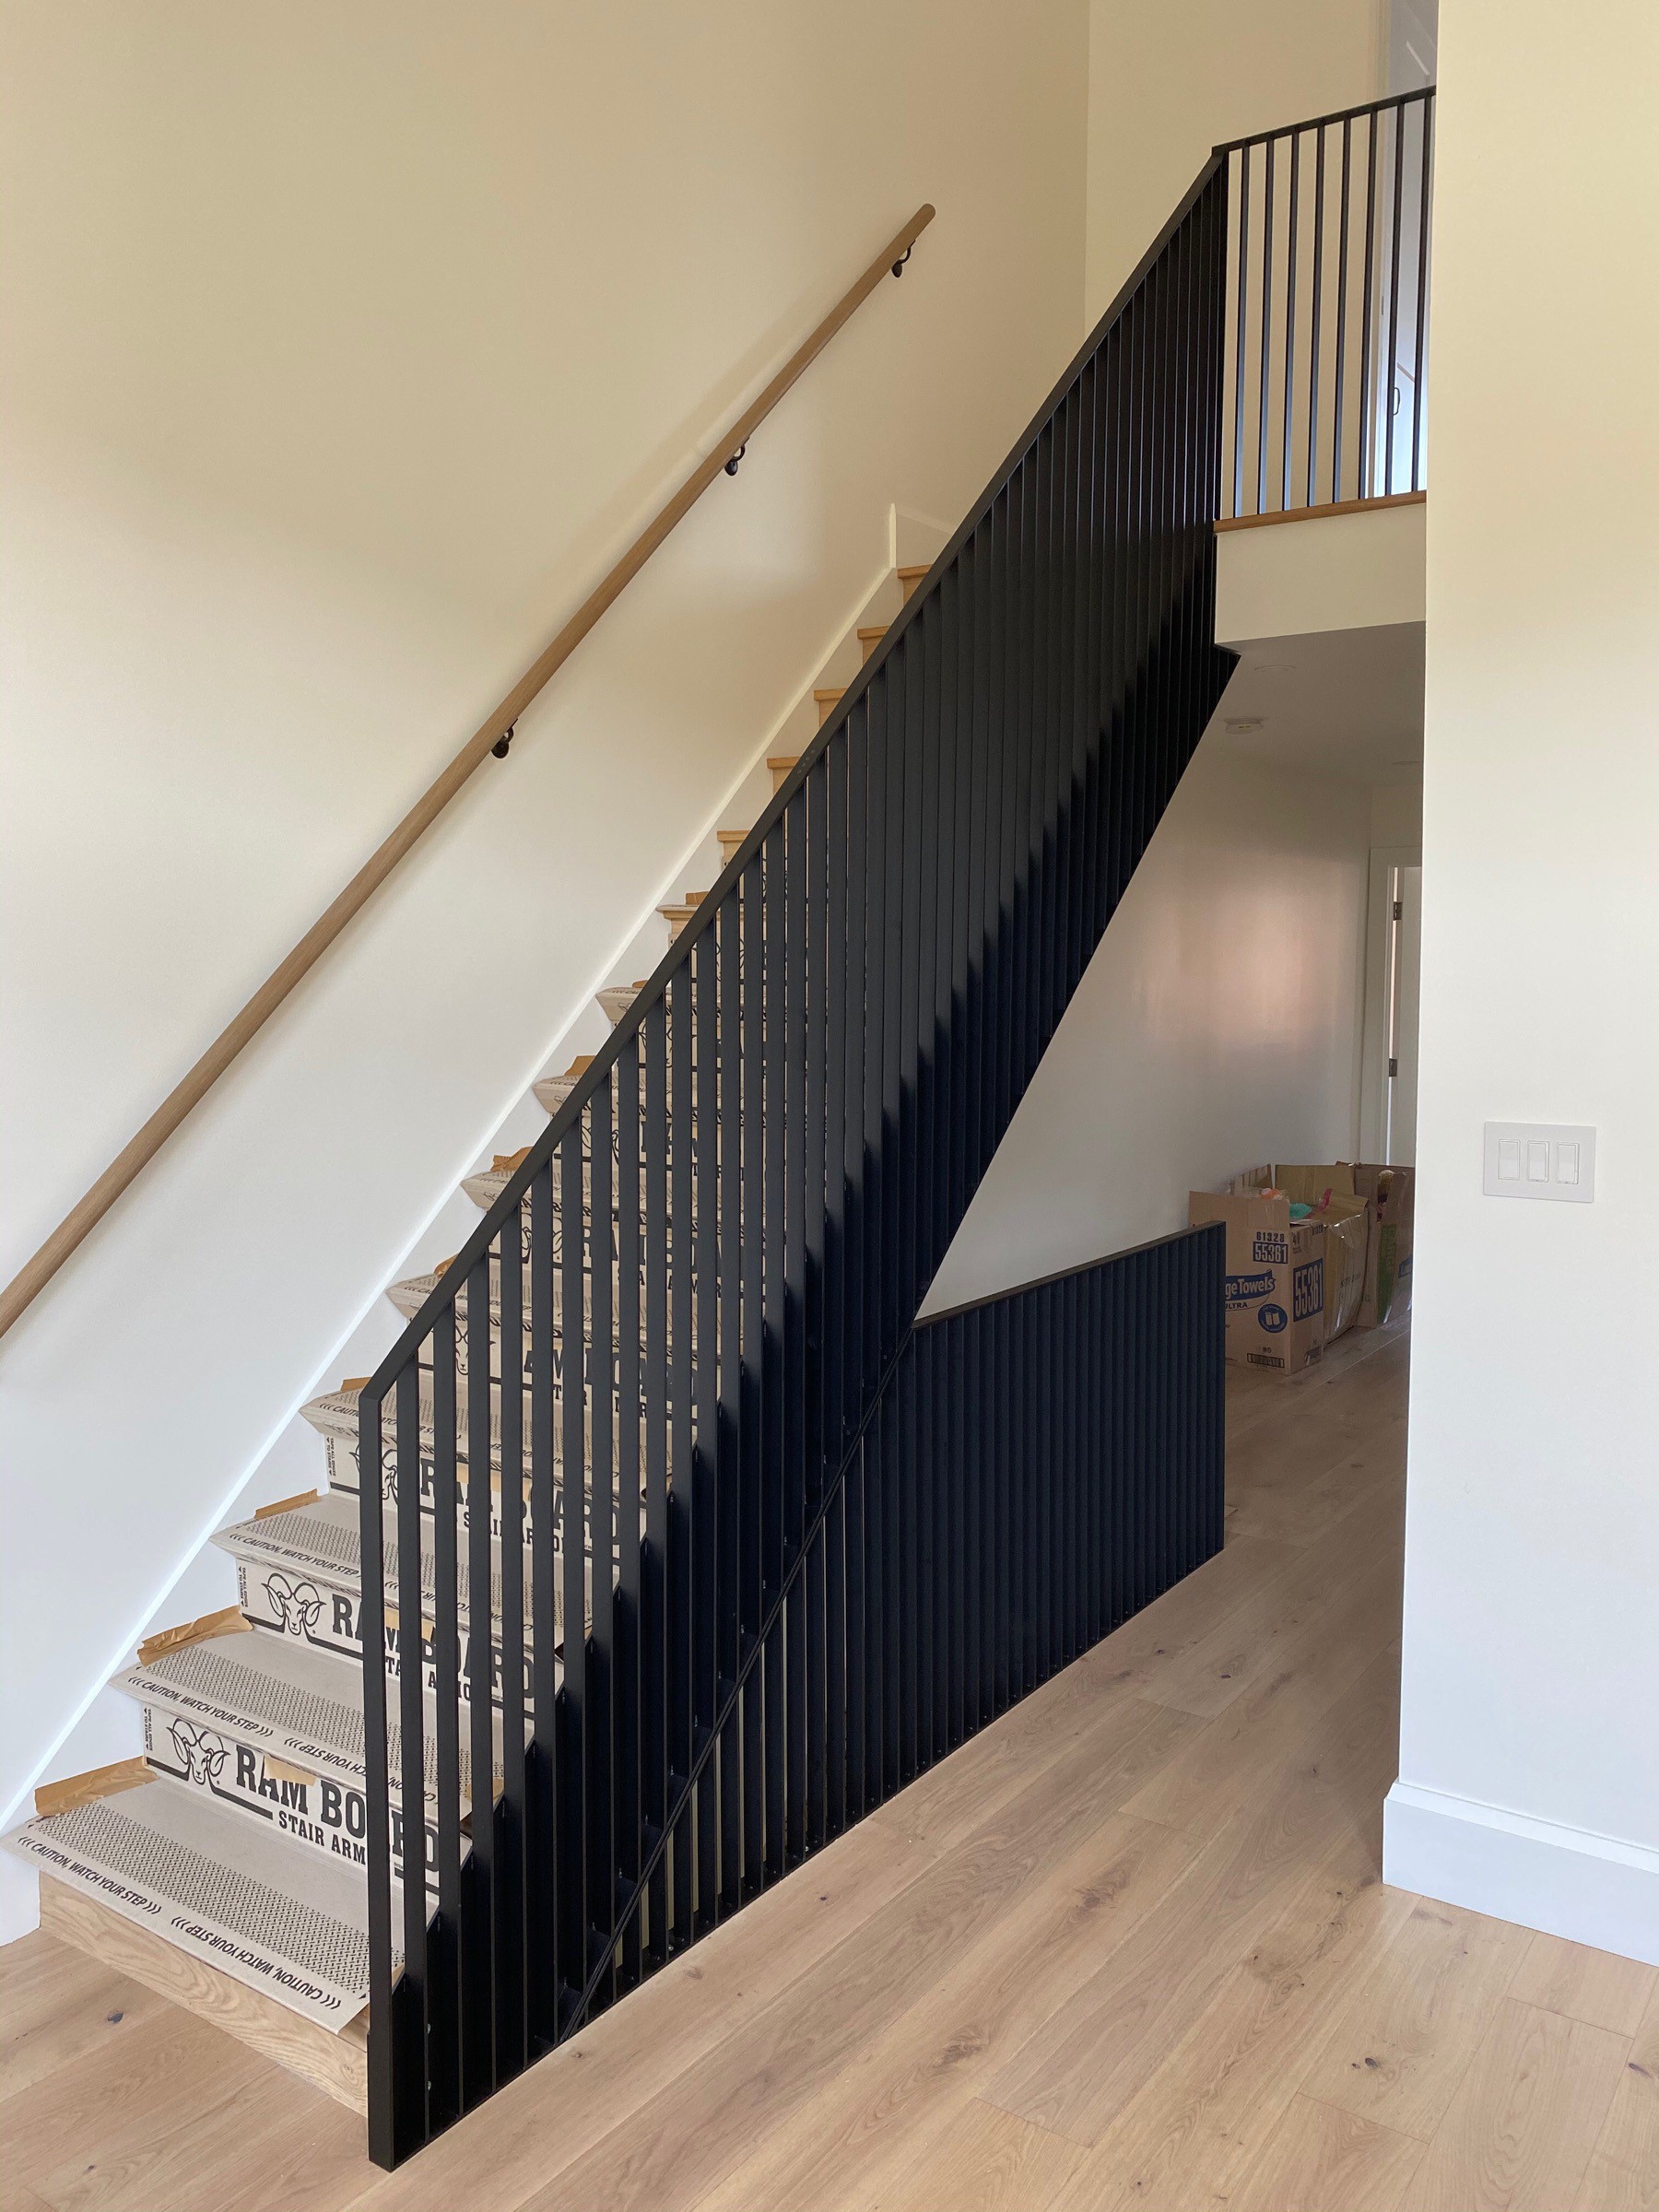
We’re very excited to move back home

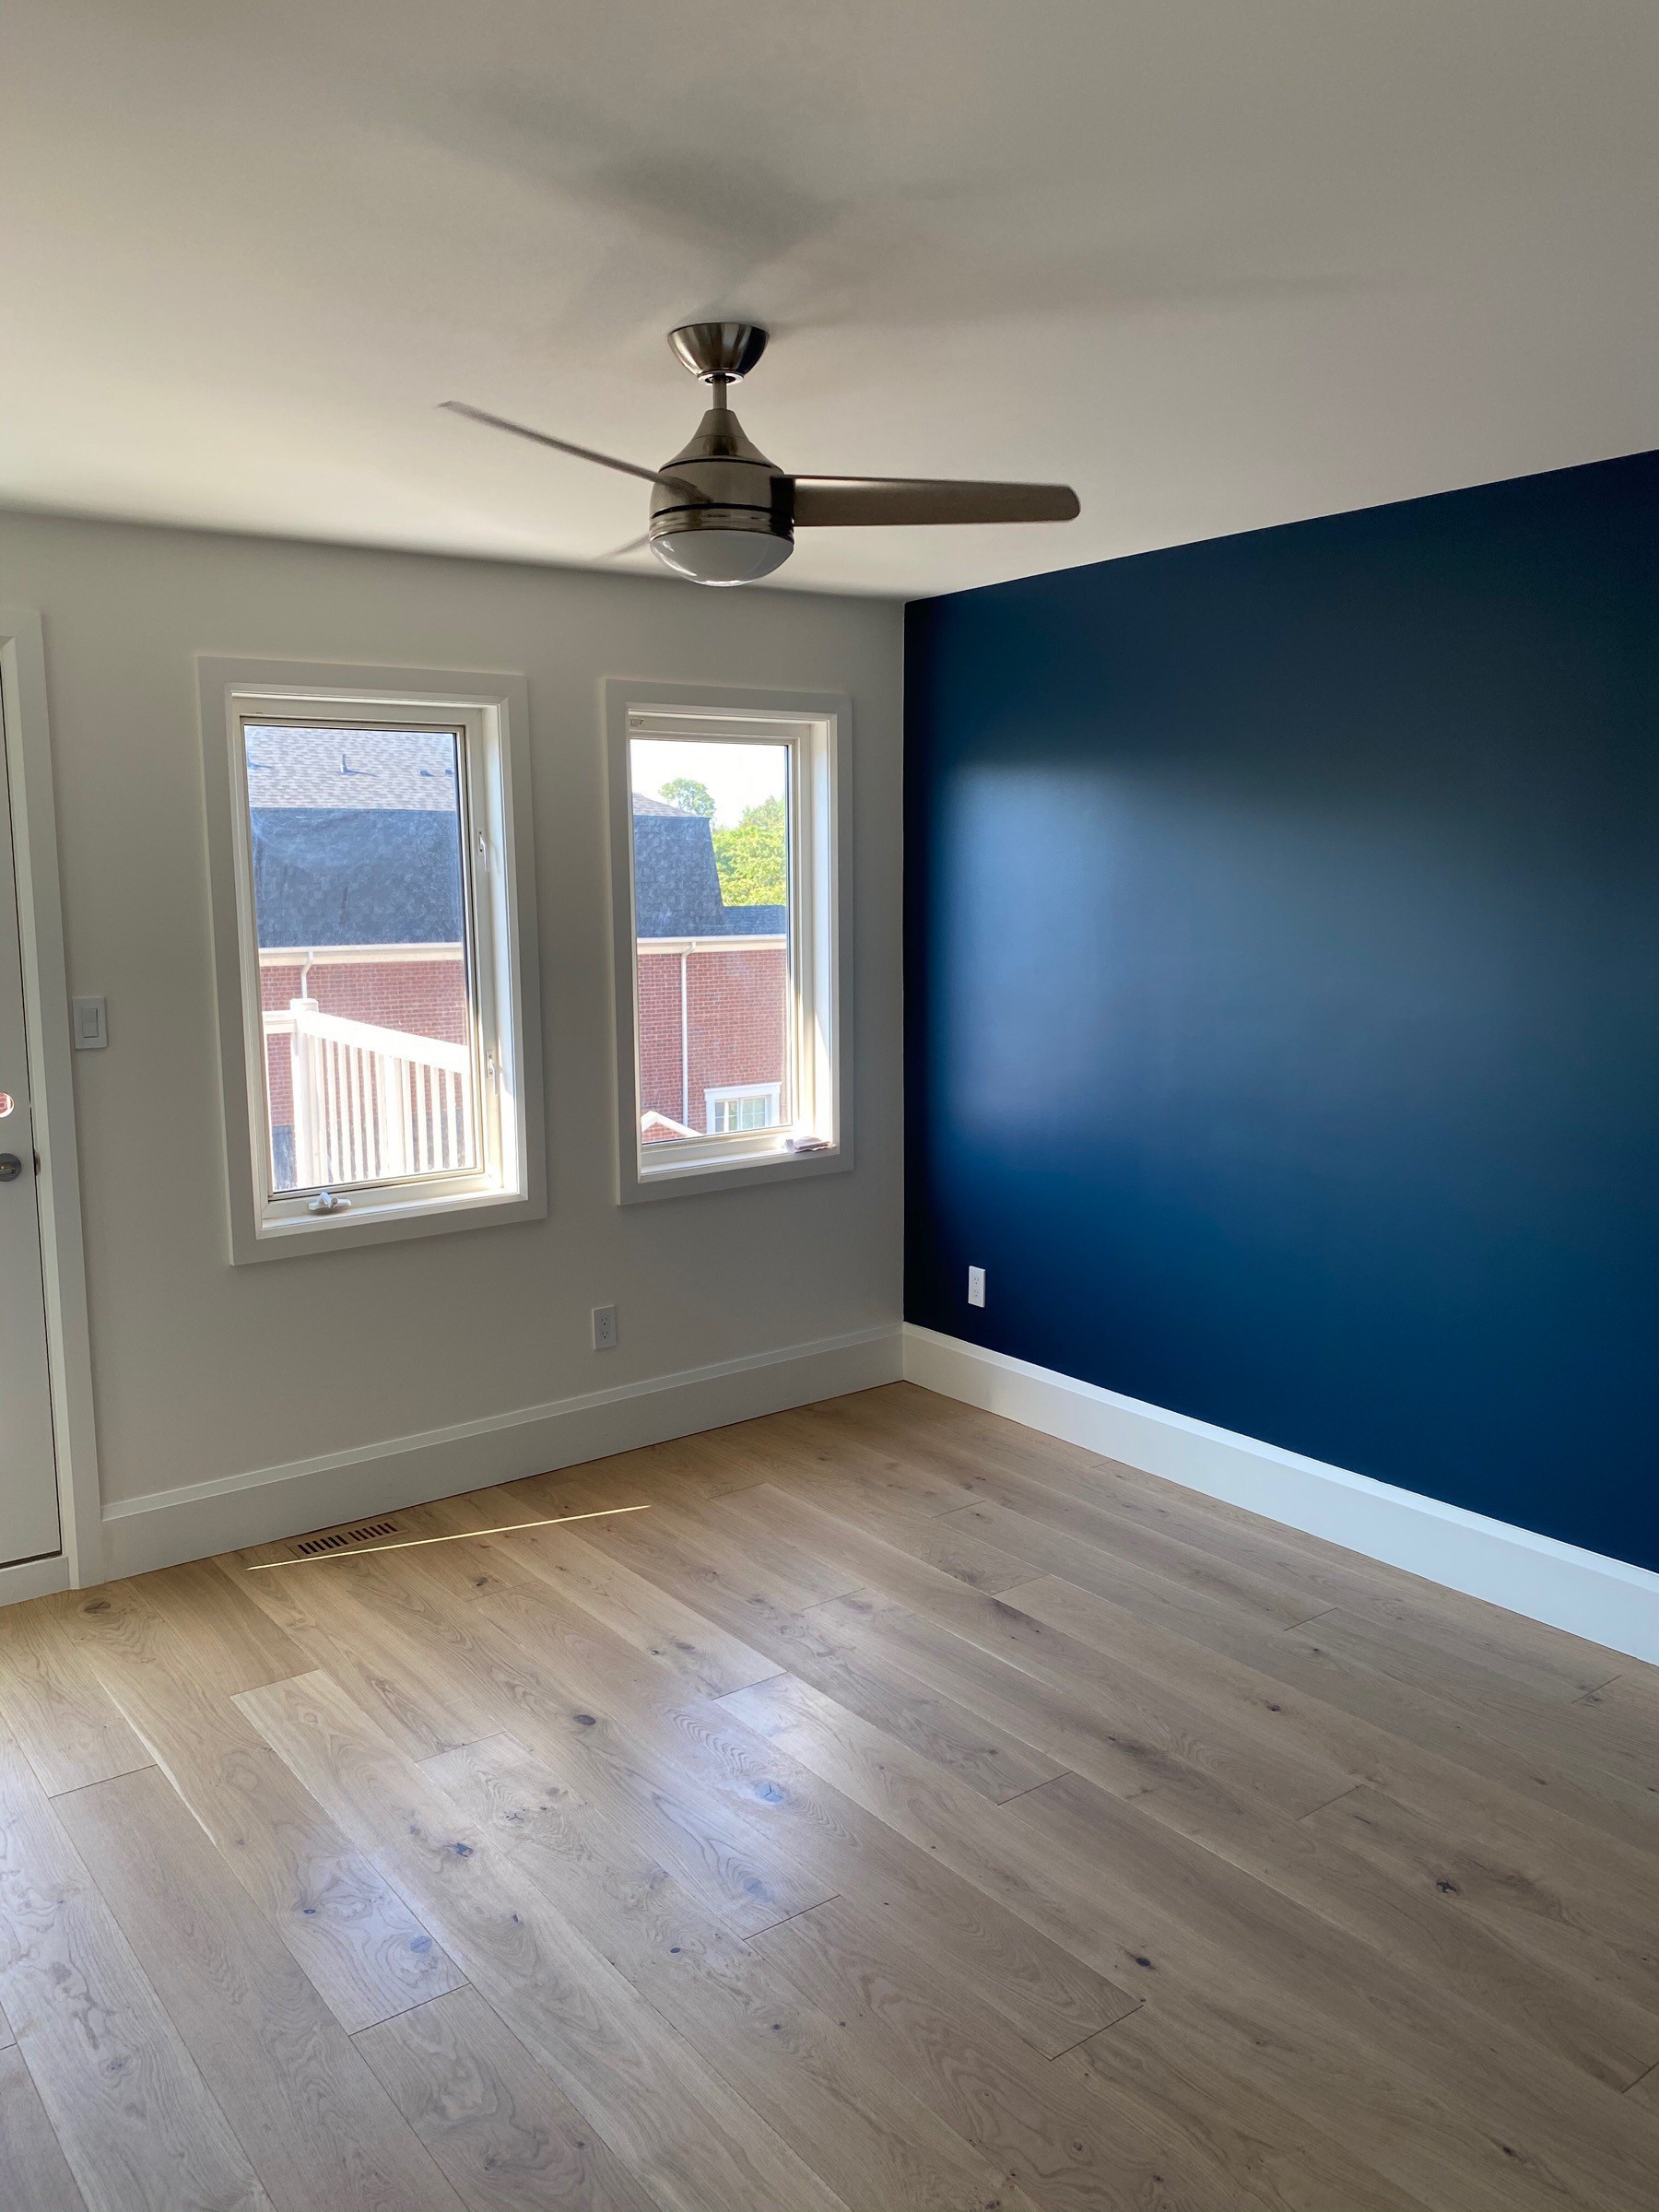
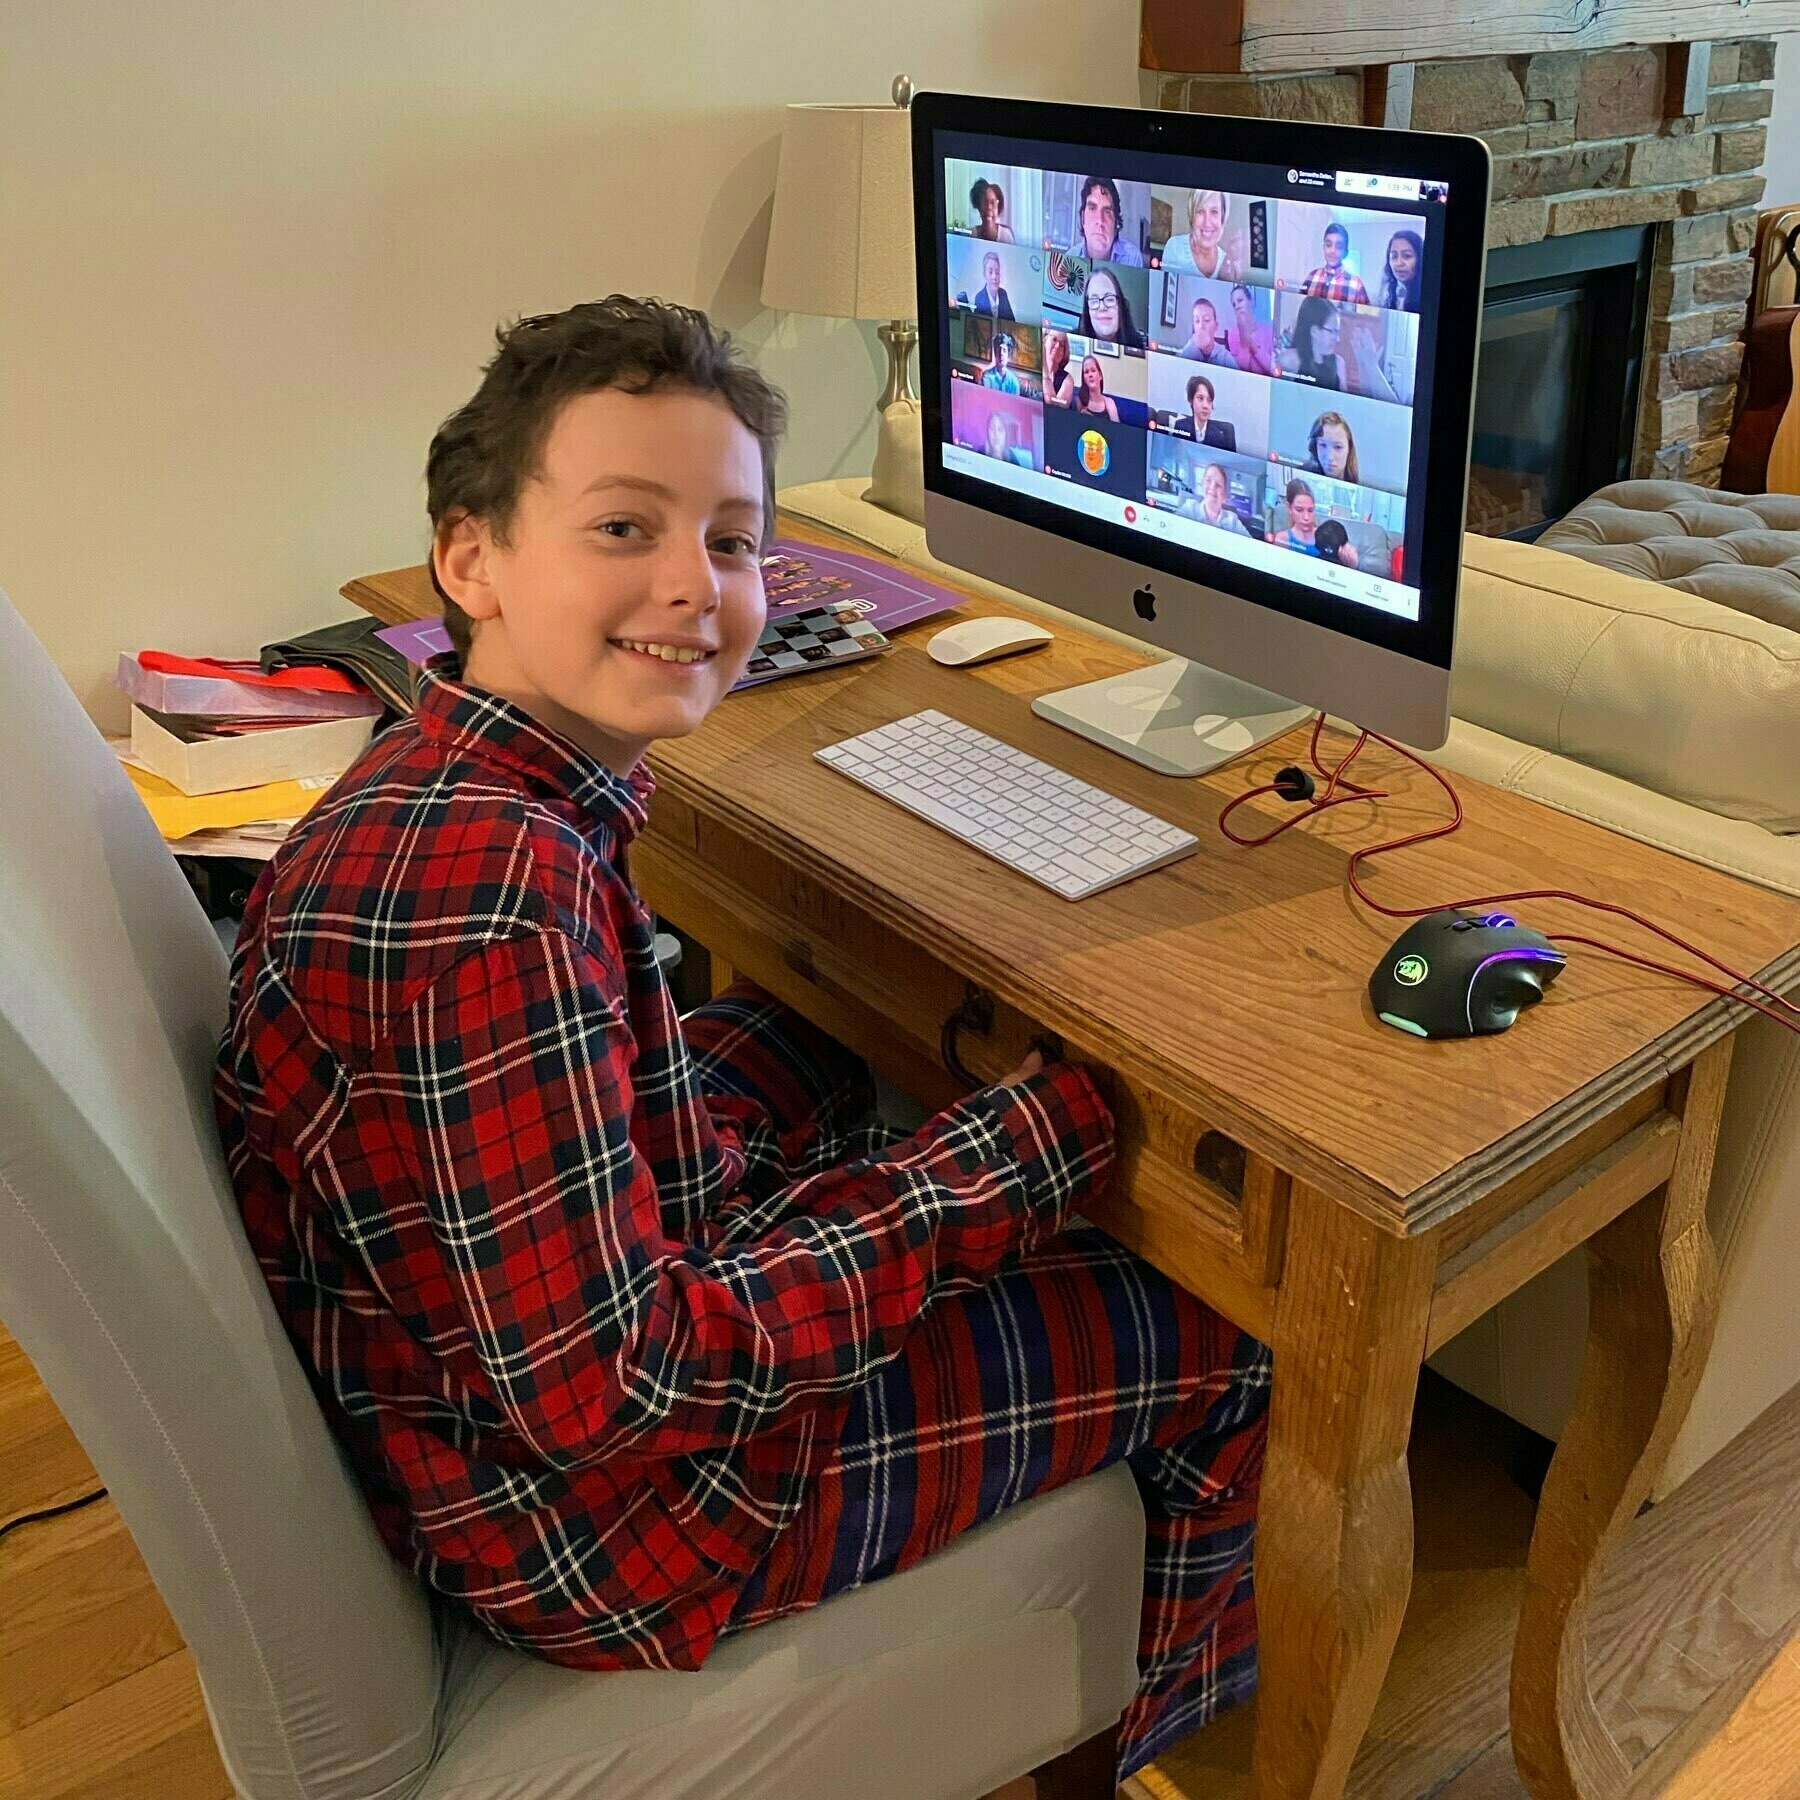
Owen had his virtual grade 6 graduation with PJs on the bottom half
Decision-Making in a Time of Crisis is a good article on the danger of confusing bad outcomes with bad decisions. As advocated in the article, scenario planning is a useful tool for making decisions with uncertainty
I’m really enjoying these unapologetically nerdy posts on the logistics and tactics of Middle Earth armies.
The Last Emperox by John Scalzi is great fun and a fitting end to the trilogy 📚
We’ve compared our predictions of the 2019 🇨🇦 election to the actual votes. Overall, we were within 5% with no obvious geographical biases, though we did slightly overestimate support for the NDP at the expense of the Liberals. I think we’re on to something good here!