I'm not analyzing COVID data, though I'm impressed with Ontario's open data
I’m neither an epidemiologist nor a medical doctor. So, no one wants to see my amateur disease modelling.
That said, I’ve complained in the past about Ontario’s open data practices. So, I was very impressed with the usefulness of the data the Province is providing for COVID: a straightforward csv file that is regularly updated from a stable URL.
Using the data is easy. Here’s an example of creating a table of daily counts and cumulative totals:
data_source <- "[data.ontario.ca/dataset/f...](https://data.ontario.ca/dataset/f4112442-bdc8-45d2-be3c-12efae72fb27/resource/455fd63b-603d-4608-8216-7d8647f43350/download/conposcovidloc.csv)"
covid_data <- read_csv(data_source) %>%
  select(ACCURATE_EPISODE_DATE) %>%
  rename(date = ACCURATE_EPISODE_DATE) %>%
  group_by(date) %>%
  summarise(daily_count = n()) %>%
  mutate(cumulative_count = cumsum(daily_count))
From there we can make some simple plots to get a sense of how the case load is changing.
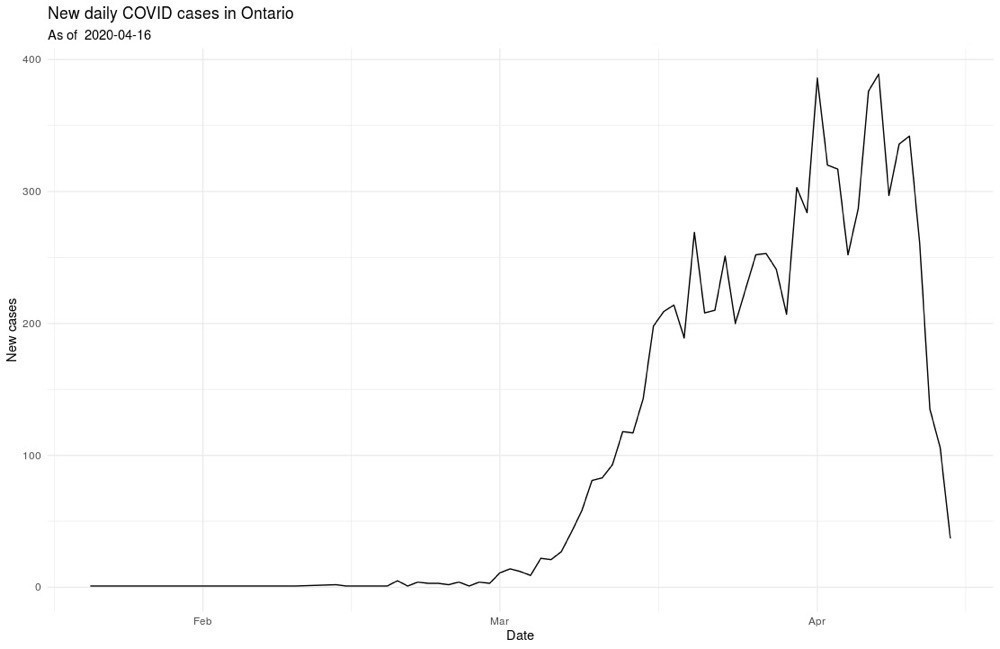
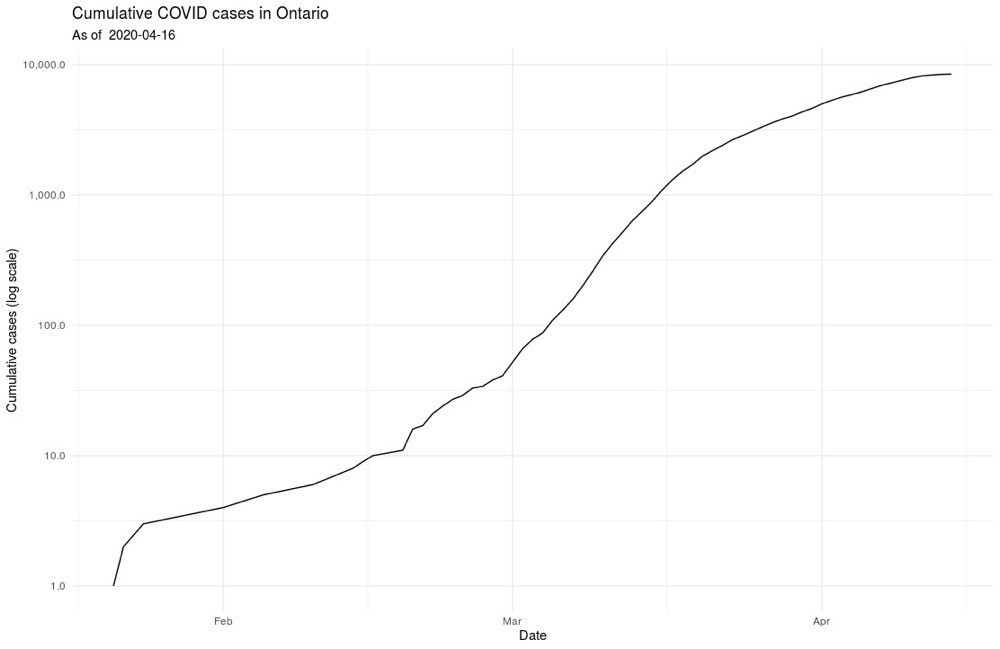
And, I’ll leave it at that, at least for public posting 🤓