Elections Ontario official results
In preparing for some PsephoAnalytics work on the upcoming provincial election, I’ve been wrangling the Elections Ontario data. As provided, the data is really difficult to work with and we’ll walk through some steps to tidy these data for later analysis.
Here’s what the source data looks like:
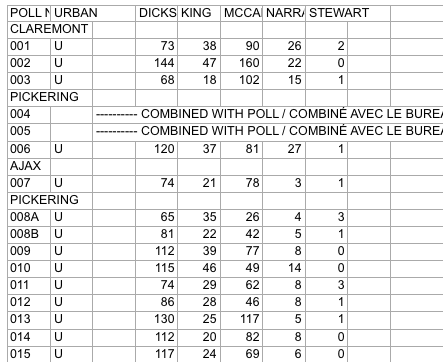
Screenshot of raw Elections Ontario data
A few problems with this:
- The data is scattered across a hundred different Excel files
- Candidates are in columns with their last name as the header
- Last names are not unique across all Electoral Districts, so can’t be used as a unique identifier
- Electoral District names are in a row, followed by a separate row for each poll within the district
- The party affiliation for each candidate isn’t included in the data
So, we have a fair bit of work to do to get to something more useful. Ideally something like:
## # A tibble: 9 x 5
##   electoral_district  poll candidate   party votes
##                <chr> <chr>     <chr>   <chr> <int>
## 1                  X     1         A Liberal    37
## 2                  X     2         B     NDP    45
## 3                  X     3         C      PC    33
## 4                  Y     1         A Liberal    71
## 5                  Y     2         B     NDP    37
## 6                  Y     3         C      PC    69
## 7                  Z     1         A Liberal    28
## 8                  Z     2         B     NDP    15
## 9                  Z     3         C      PC    34
This is much easier to work with: we have one row for the votes received by each candidate at each poll, along with the Electoral District name and their party affiliation.
Candidate parties
As a first step, we need the party affiliation for each candidate. I didn’t see this information on the Elections Ontario site. So, we’ll pull the data from Wikipedia. The data on this webpage isn’t too bad. We can just use the table xpath selector to pull out the tables and then drop the ones we aren’t interested in.
``` candidate_webpage <- "https://en.wikipedia.org/wiki/Ontario_general_election,_2014#Candidates_by_region" candidate_tables <- "table" # Use an xpath selector to get the drop down list by IDcandidates <- xml2::read_html(candidate_webpage) %>% rvest::html_nodes(candidate_tables) %>% # Pull tables from the wikipedia entry .[13:25] %>% # Drop unecessary tables rvest::html_table(fill = TRUE)
</pre> <p>This gives us a list of 13 data frames, one for each table on the webpage. Now we cycle through each of these and stack them into one data frame. Unfortunately, the tables aren’t consistent in the number of columns. So, the approach is a bit messy and we process each one in a loop.</p> <pre class="r"><code># Setup empty dataframe to store results candidate_parties <- tibble::as_tibble( electoral_district_name = NULL, party = NULL, candidate = NULL ) for(i in seq_along(1:length(candidates))) { # Messy, but works this_table <- candidates[[i]] # The header spans mess up the header row, so renaming names(this_table) <- c(this_table[1,-c(3,4)], "NA", "Incumbent") # Get rid of the blank spacer columns this_table <- this_table[-1, ] # Drop the NA columns by keeping only odd columns this_table <- this_table[,seq(from = 1, to = dim(this_table)[2], by = 2)] this_table %<>% tidyr::gather(party, candidate, -`Electoral District`) %>% dplyr::rename(electoral_district_name = `Electoral District`) %>% dplyr::filter(party != "Incumbent") candidate_parties <- dplyr::bind_rows(candidate_parties, this_table) } candidate_parties</code></pre> <pre># A tibble: 649 x 3
electoral_district_name party candidate
1 Carleton—Mississippi Mills Liberal Rosalyn Stevens
2 Nepean—Carleton Liberal Jack Uppal
3 Ottawa Centre Liberal Yasir Naqvi
4 Ottawa—Orléans Liberal Marie-France Lalonde
5 Ottawa South Liberal John Fraser
6 Ottawa—Vanier Liberal Madeleine Meilleur
7 Ottawa West—Nepean Liberal Bob Chiarelli
8 Carleton—Mississippi Mills PC Jack MacLaren
9 Nepean—Carleton PC Lisa MacLeod
10 Ottawa Centre PC Rob Dekker
# … with 639 more rows
</pre> </div> <div id="electoral-district-names" class="section level2"> <h2>Electoral district names</h2> <p>One issue with pulling party affiliations from Wikipedia is that candidates are organized by Electoral District <em>names</em>. But the voting results are organized by Electoral District <em>number</em>. I couldn’t find an appropriate resource on the Elections Ontario site. Rather, here we pull the names and numbers of the Electoral Districts from the <a href="https://www3.elections.on.ca/internetapp/FYED_Error.aspx?lang=en-ca">Find My Electoral District</a> website. The xpath selector is a bit tricky for this one. The <code>ed_xpath</code> object below actually pulls content from the drop down list that appears when you choose an Electoral District. One nuisance with these data is that Elections Ontario uses <code>--</code> in the Electoral District names, instead of the — used on Wikipedia. We use <code>str_replace_all</code> to fix this below.</p> <pre class="r"><code>ed_webpage <- "https://www3.elections.on.ca/internetapp/FYED_Error.aspx?lang=en-ca" ed_xpath <- "//*[(@id = \"ddlElectoralDistricts\")]" # Use an xpath selector to get the drop down list by ID electoral_districts <- xml2::read_html(ed_webpage) %>% rvest::html_node(xpath = ed_xpath) %>% rvest::html_nodes("option") %>% rvest::html_text() %>% .[-1] %>% # Drop the first item on the list ("Select...") tibble::as.tibble() %>% # Convert to a data frame and split into ID number and name tidyr::separate(value, c("electoral_district", "electoral_district_name"), sep = " ", extra = "merge") %>% # Clean up district names for later matching and presentation dplyr::mutate(electoral_district_name = stringr::str_to_title( stringr::str_replace_all(electoral_district_name, "--", "—"))) electoral_districts</code></pre> <pre># A tibble: 107 x 2
electoral_district electoral_district_name
1 001 Ajax—Pickering
2 002 Algoma—Manitoulin
3 003 Ancaster—Dundas—Flamborough—Westdale
4 004 Barrie
5 005 Beaches—East York
6 006 Bramalea—Gore—Malton
7 007 Brampton—Springdale
8 008 Brampton West
9 009 Brant
10 010 Bruce—Grey—Owen Sound
# … with 97 more rows
</pre> <p>Next, we can join the party affiliations to the Electoral District names to join candidates to parties and district numbers.</p> <pre class="r"><code>candidate_parties %<>% # These three lines are cleaning up hyphens and dashes, seems overly complicated dplyr::mutate(electoral_district_name = stringr::str_replace_all(electoral_district_name, "—\n", "—")) %>% dplyr::mutate(electoral_district_name = stringr::str_replace_all(electoral_district_name, "Chatham-Kent—Essex", "Chatham—Kent—Essex")) %>% dplyr::mutate(electoral_district_name = stringr::str_to_title(electoral_district_name)) %>% dplyr::left_join(electoral_districts) %>% dplyr::filter(!candidate == "") %>% # Since the vote data are identified by last names, we split candidate's names into first and last tidyr::separate(candidate, into = c("first","candidate"), extra = "merge", remove = TRUE) %>% dplyr::select(-first)</code></pre> <pre><code>## Joining, by = "electoral_district_name"</code></pre> <pre class="r"><code>candidate_parties</code></pre> <pre># A tibble: 578 x 4
electoral_district_name party candidate electoral_district
*
1 Carleton—Mississippi Mills Liberal Stevens 013
2 Nepean—Carleton Liberal Uppal 052
3 Ottawa Centre Liberal Naqvi 062
4 Ottawa—Orléans Liberal France Lalonde 063
5 Ottawa South Liberal Fraser 064
6 Ottawa—Vanier Liberal Meilleur 065
7 Ottawa West—Nepean Liberal Chiarelli 066
8 Carleton—Mississippi Mills PC MacLaren 013
9 Nepean—Carleton PC MacLeod 052
10 Ottawa Centre PC Dekker 062
# … with 568 more rows
</pre> <p>All that work just to get the name of each candiate for each Electoral District name and number, plus their party affiliation.</p> </div> <div id="votes" class="section level2"> <h2>Votes</h2> <p>Now we can finally get to the actual voting data. These are made available as a collection of Excel files in a compressed folder. To avoid downloading it more than once, we wrap the call in an <code>if</code> statement that first checks to see if we already have the file. We also rename the file to something more manageable.</p> <pre class="r"><code>raw_results_file <- "[www.elections.on.ca/content/d...](http://www.elections.on.ca/content/dam/NGW/sitecontent/2017/results/Poll%20by%20Poll%20Results%20-%20Excel.zip)" zip_file <- "data-raw/Poll%20by%20Poll%20Results%20-%20Excel.zip" if(file.exists(zip_file)) { # Only download the data once # File exists, so nothing to do } else { download.file(raw_results_file, destfile = zip_file) unzip(zip_file, exdir="data-raw") # Extract the data into data-raw file.rename("data-raw/GE Results - 2014 (unconverted)", "data-raw/pollresults") }</code></pre> <pre><code>## NULL</code></pre> <p>Now we need to extract the votes out of 107 Excel files. The combination of <code>purrr</code> and <code>readxl</code> packages is great for this. In case we want to filter to just a few of the files (perhaps to target a range of Electoral Districts), we declare a <code>file_pattern</code>. For now, we just set it to any xls file that ends with three digits preceeded by a “_“.</p> <p>As we read in the Excel files, we clean up lots of blank columns and headers. Then we convert to a long table and drop total and blank rows. Also, rather than try to align the Electoral District name rows with their polls, we use the name of the Excel file to pull out the Electoral District number. Then we join with the <code>electoral_districts</code> table to pull in the Electoral District names.</p> <pre class="r">file_pattern <- “*_[[:digit:]]{3}.xls” # Can use this to filter down to specific files poll_data <- list.files(path = “data-raw/pollresults”, pattern = file_pattern, full.names = TRUE) %>% # Find all files that match the pattern purrr::set_names() %>% purrr::map_df(readxl::read_excel, sheet = 1, col_types = “text”, .id = “file”) %>% # Import each file and merge into a dataframe
Specifying sheet = 1 just to be clear we’re ignoring the rest of the sheets
Declare col_types since there are duplicate surnames and map_df can’t recast column types in the rbind
For example, Bell is in both district 014 and 063
dplyr::select(-starts_with(“X__")) %>% # Drop all of the blank columns dplyr::select(1:2,4:8,15:dim(.)[2]) %>% # Reorganize a bit and drop unneeded columns dplyr::rename(poll_number =
POLL NO.) %>% tidyr::gather(candidate, votes, -file, -poll_number) %>% # Convert to a long table dplyr::filter(!is.na(votes), poll_number != “Totals”) %>% dplyr::mutate(electoral_district = stringr::str_extract(file, “[[:digit:]]{3}"), votes = as.numeric(votes)) %>% dplyr::select(-file) %>% dplyr::left_join(electoral_districts) poll_data</pre> <pre># A tibble: 143,455 x 5
poll_number candidate votes electoral_district electoral_district_name
1 001 DICKSON 73 001 Ajax—Pickering
2 002 DICKSON 144 001 Ajax—Pickering
3 003 DICKSON 68 001 Ajax—Pickering
4 006 DICKSON 120 001 Ajax—Pickering
5 007 DICKSON 74 001 Ajax—Pickering
6 008A DICKSON 65 001 Ajax—Pickering
7 008B DICKSON 81 001 Ajax—Pickering
8 009 DICKSON 112 001 Ajax—Pickering
9 010 DICKSON 115 001 Ajax—Pickering
10 011 DICKSON 74 001 Ajax—Pickering
# … with 143,445 more rows
</pre> <p>The only thing left to do is to join <code>poll_data</code> with <code>candidate_parties</code> to add party affiliation to each candidate. Because the names don’t always exactly match between these two tables, we use the <code>fuzzyjoin</code> package to join by closest spelling.</p> <pre class="r"><code>poll_data_party_match_table <- poll_data %>% group_by(candidate, electoral_district_name) %>% summarise() %>% fuzzyjoin::stringdist_left_join(candidate_parties, ignore_case = TRUE) %>% dplyr::select(candidate = candidate.x, party = party, electoral_district = electoral_district) %>% dplyr::filter(!is.na(party)) poll_data %<>% dplyr::left_join(poll_data_party_match_table) %>% dplyr::group_by(electoral_district, party) tibble::glimpse(poll_data)</code></pre> <pre>Observations: 144,323
Variables: 6
$ poll_number
“001”, “002”, “003”, “006”, “007”, “00… $ candidate
“DICKSON”, “DICKSON”, “DICKSON”, “DICK… $ votes
73, 144, 68, 120, 74, 65, 81, 112, 115… $ electoral_district
“001”, “001”, “001”, “001”, “001”, “00… $ electoral_district_name
“Ajax—Pickering”, “Ajax—Pickering”, “A… $ party
“Liberal”, “Liberal”, “Liberal”, “Libe… </pre> <p>And, there we go. One table with a row for the votes received by each candidate at each poll. It would have been great if Elections Ontario released data in this format and we could have avoided all of this work.</p> </div>