Vector assignment in R
As I use R for data analysis and simulations, I become more comfortable and proficient with the R/S syntax and style of programming. One important insight is the use of vector assignments in simulations. I have often read that using such assignments is the preferred method, but until recently I had not realised the importance of this statement. To illustrate the use of vector assignments and their advantages, consider two models of the style illustrated below:
Model 1:
 value1List <- seq(1:10)
 value2Function <- function (value1) {
     ifelse(value1 < constant1, constant2, constant1)
 }
 tableDimension <- length(value1List)
 outputTable <- NULL
 outputTable <- data.frame(value1=numeric(tableDimension),
 value2=numeric(tableDimension))
 n <- 1
 for (value1 in value1List) {
     outputTable[n, ] <- c(value1, value2Function(value1))
     n <- n + 1
 }
Model 2:
 value1List <- seq(1:10)
 tableDimension <- length(value1List)
 outputTable <- NULL
 outputTable$value1 <- rep(value1List, each=
     tableDimension / (length(value1List)))
 outputTable <- as.data.frame(outputTable)
 outputTable$value2 <- ifelse(value1 < constant1, constant2, constant1)
Model 1 is how I originally approached R programming. It begins with declaration of a sequence for value1 and a function declaration to calculate value2 from each value1. I then declare a table to capture the output and fill it with zero values. The main loop of the program consists of replacing the rows of the output table with each value of value1 and the calculated value2. I use the variable n to keep track of the next row in the table. The function rbind() could also be used to generate the table, but it’s use for large datasets is quite inefficient.
Model 2 takes the approach of constructing each column of the output table in sequence. It begins by repeating the values of the value1List and then creates the value2 column through a vector assignment. No control structures or function calls are required in Model 2.
How is this important? Model 1 seems intuitive (at least to me) while the syntax of Model 2 is opaque at first glance. However, consider this figure:
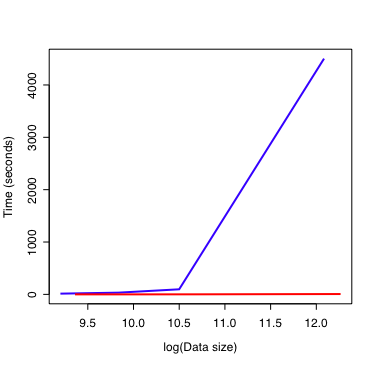
On the x-axis is the number of data points in the output table on a log scale. The y-axis shows how long the model takes to calculate these values. Model 1 is the blue line. Model 2 is the red line. This illustrates two important points: * Model 1 is always slower than Model 2. * As the size of the dataset increases, Model 2 remains fast while Model 1 rapidly consumes all of the computer resources.
This is why vector assignments should be used when programming with R. Just to be clear, the models described here are simple abstractions of the types of models used to generate this figure.