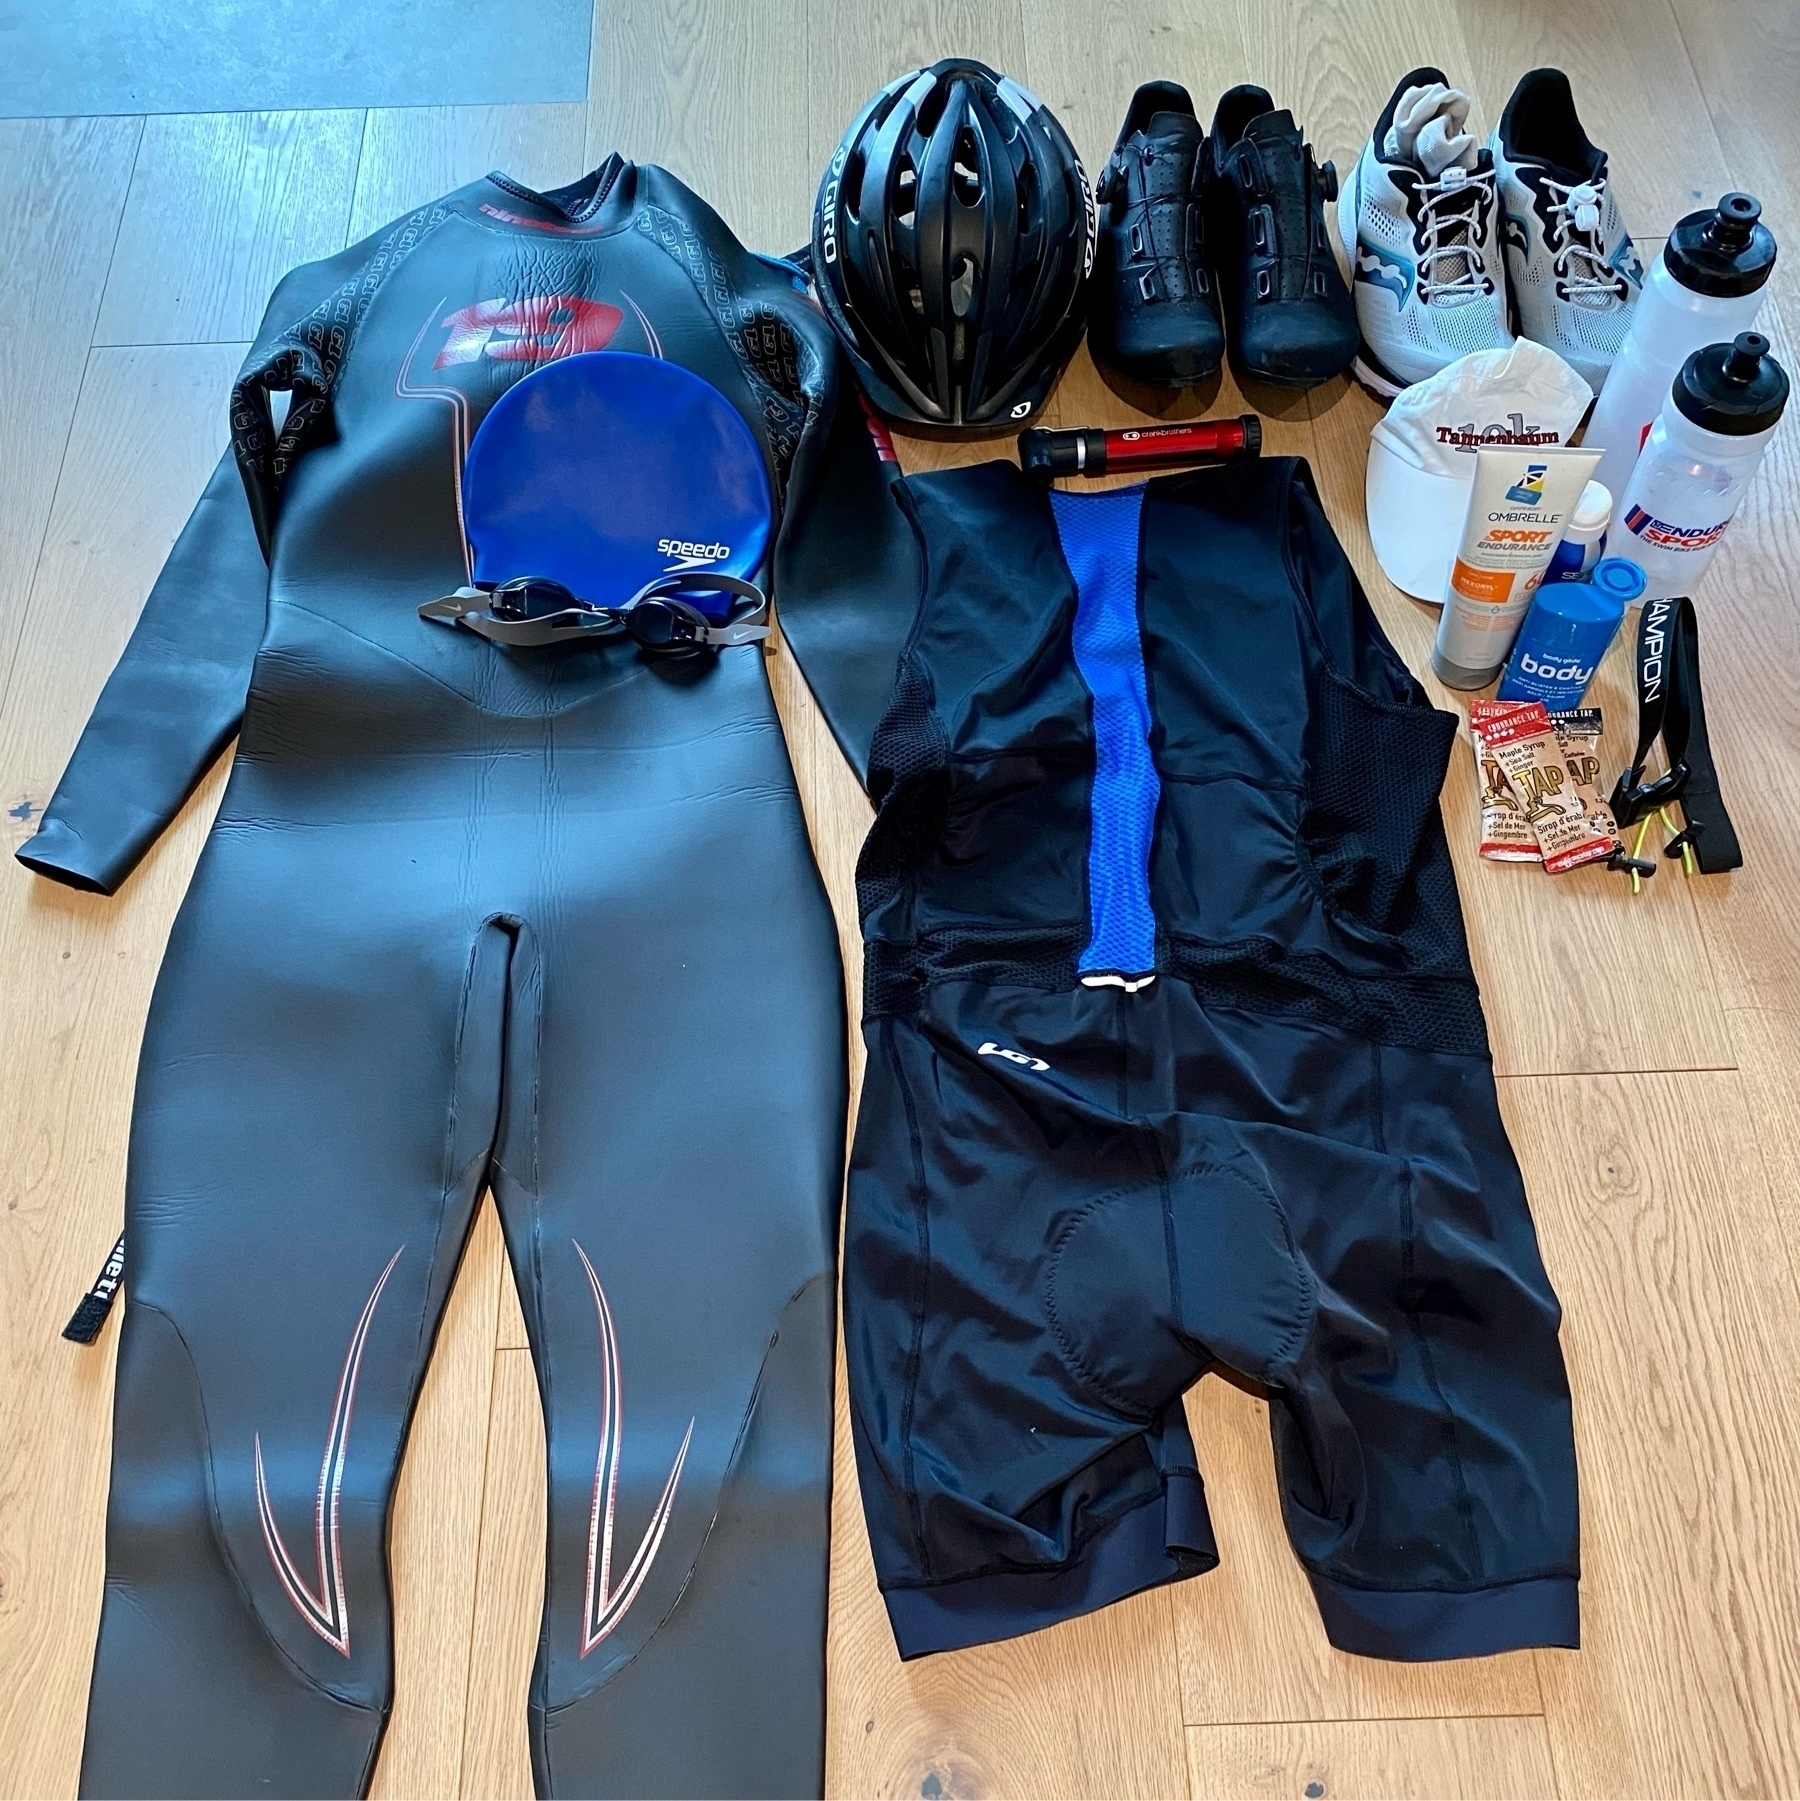
A big thank you to my race crew for their support at today’s triathlon.

A big thank you to my race crew for their support at today’s triathlon.
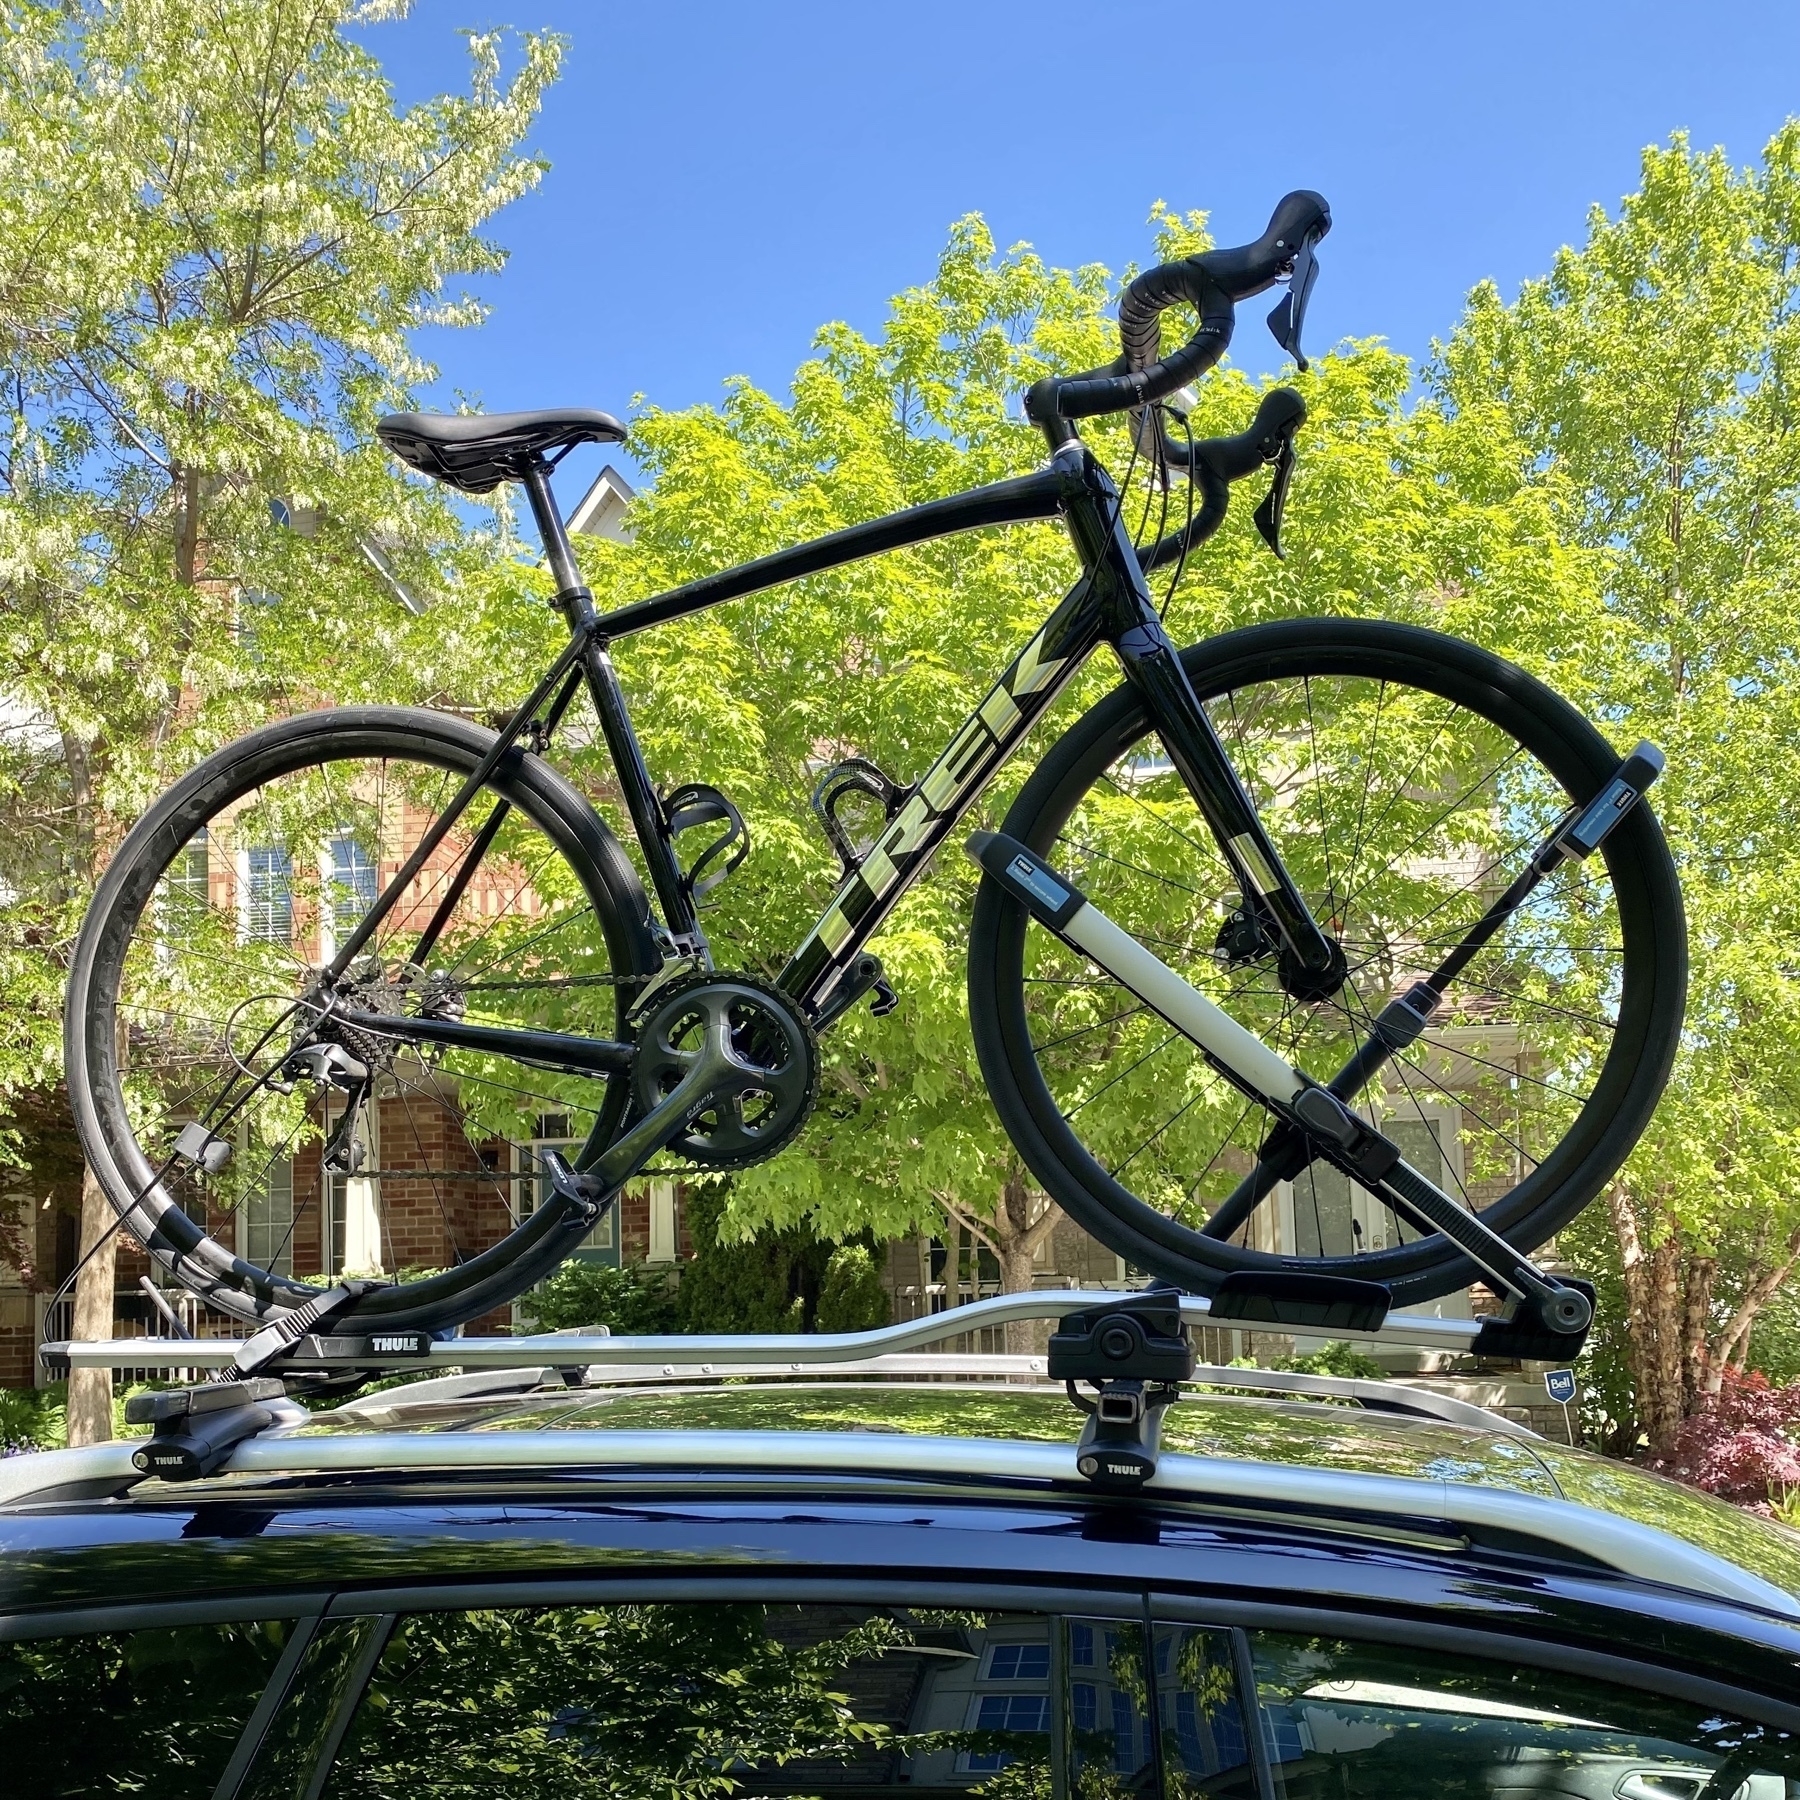
First time using the new bike rack.
I think this is everything!
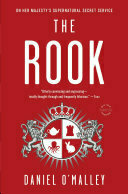
Finished reading: I really enjoyed The Rook by Daniel O’Malley. A fun mix of espionage and supernatural with a good sense of humour 📚
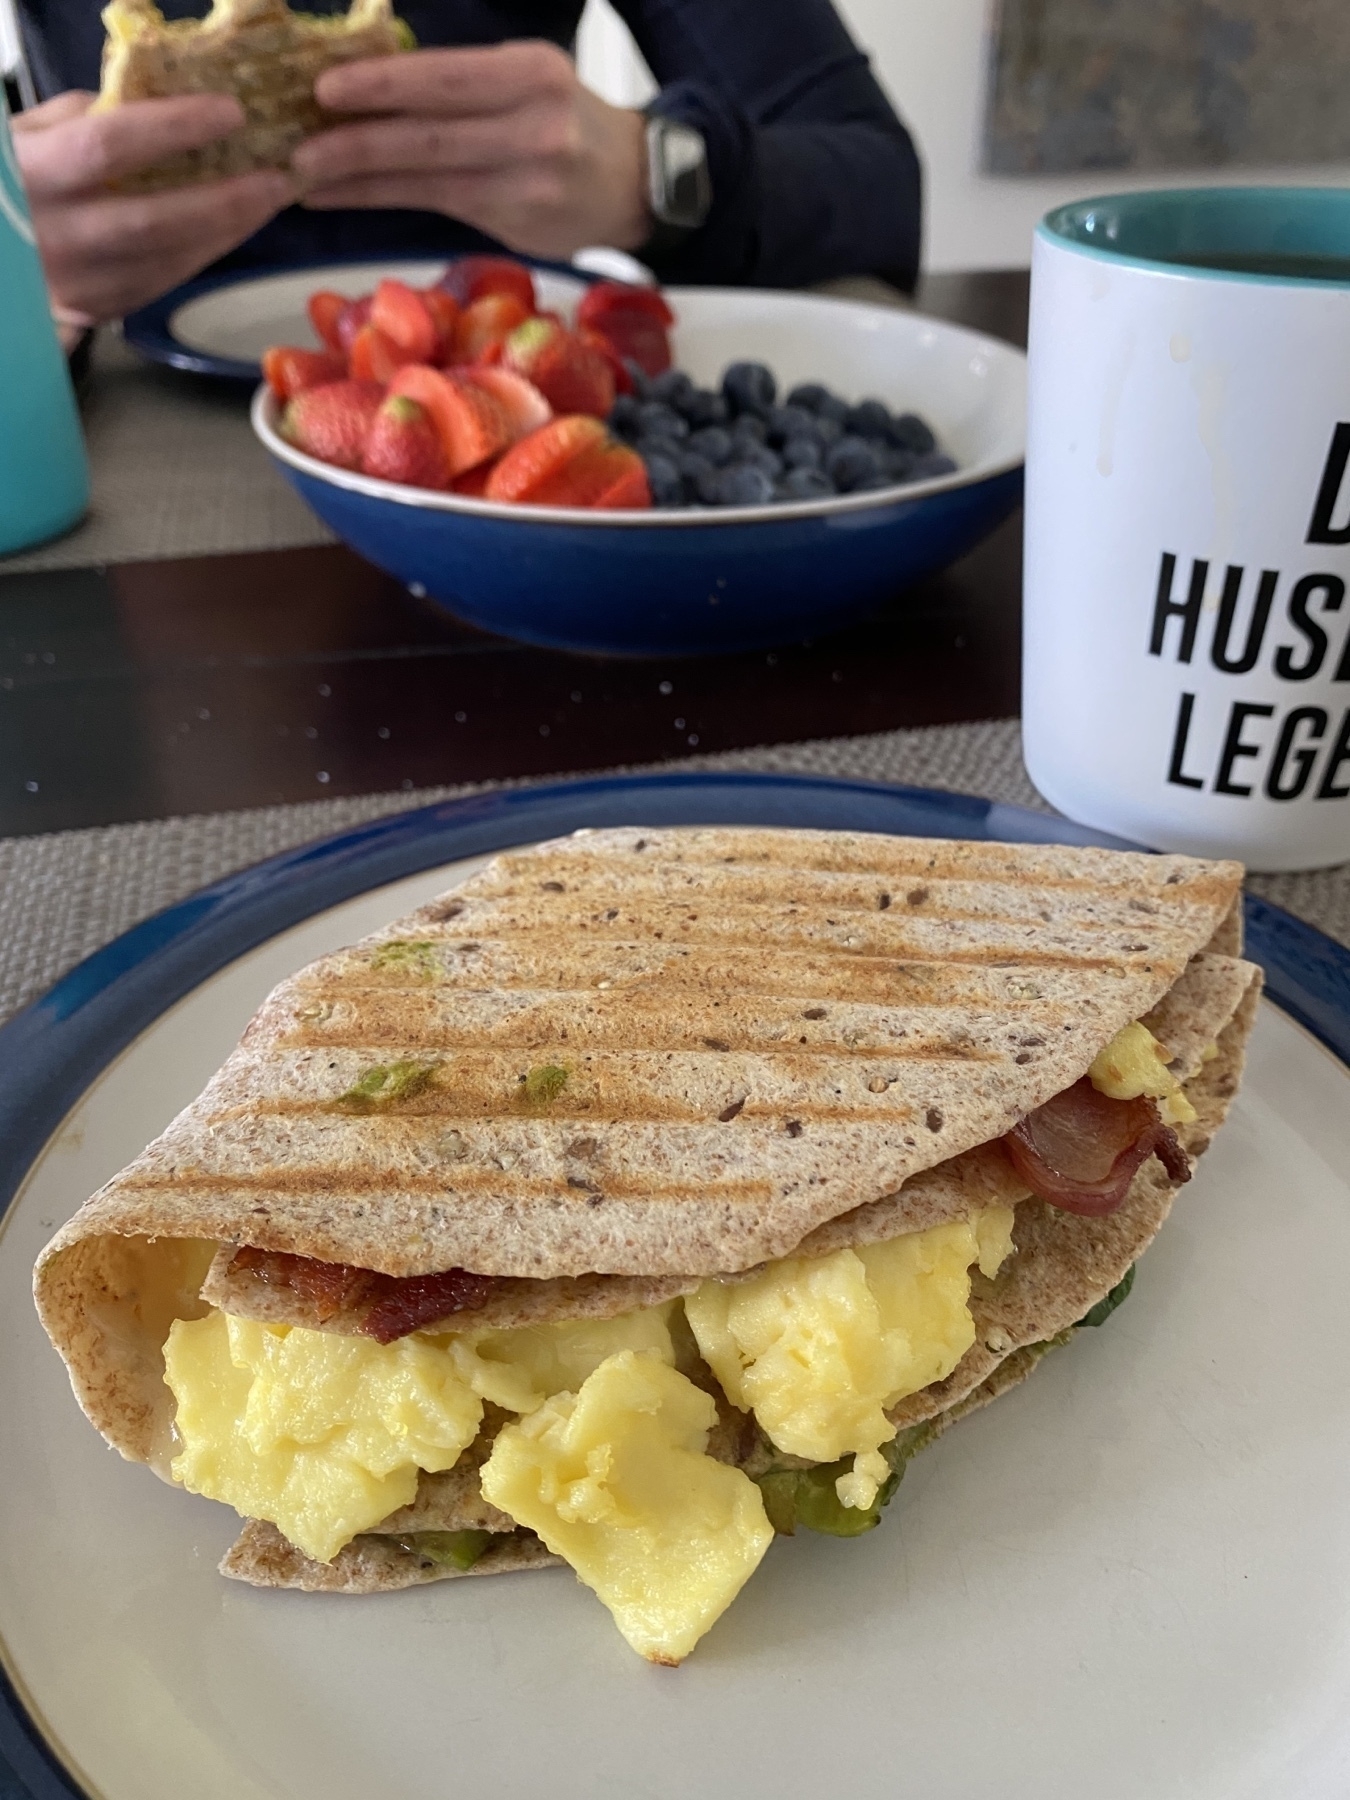
Day 19: Breakfast indulgence: scrambled eggs, bacon, avocado, and cheese 📷
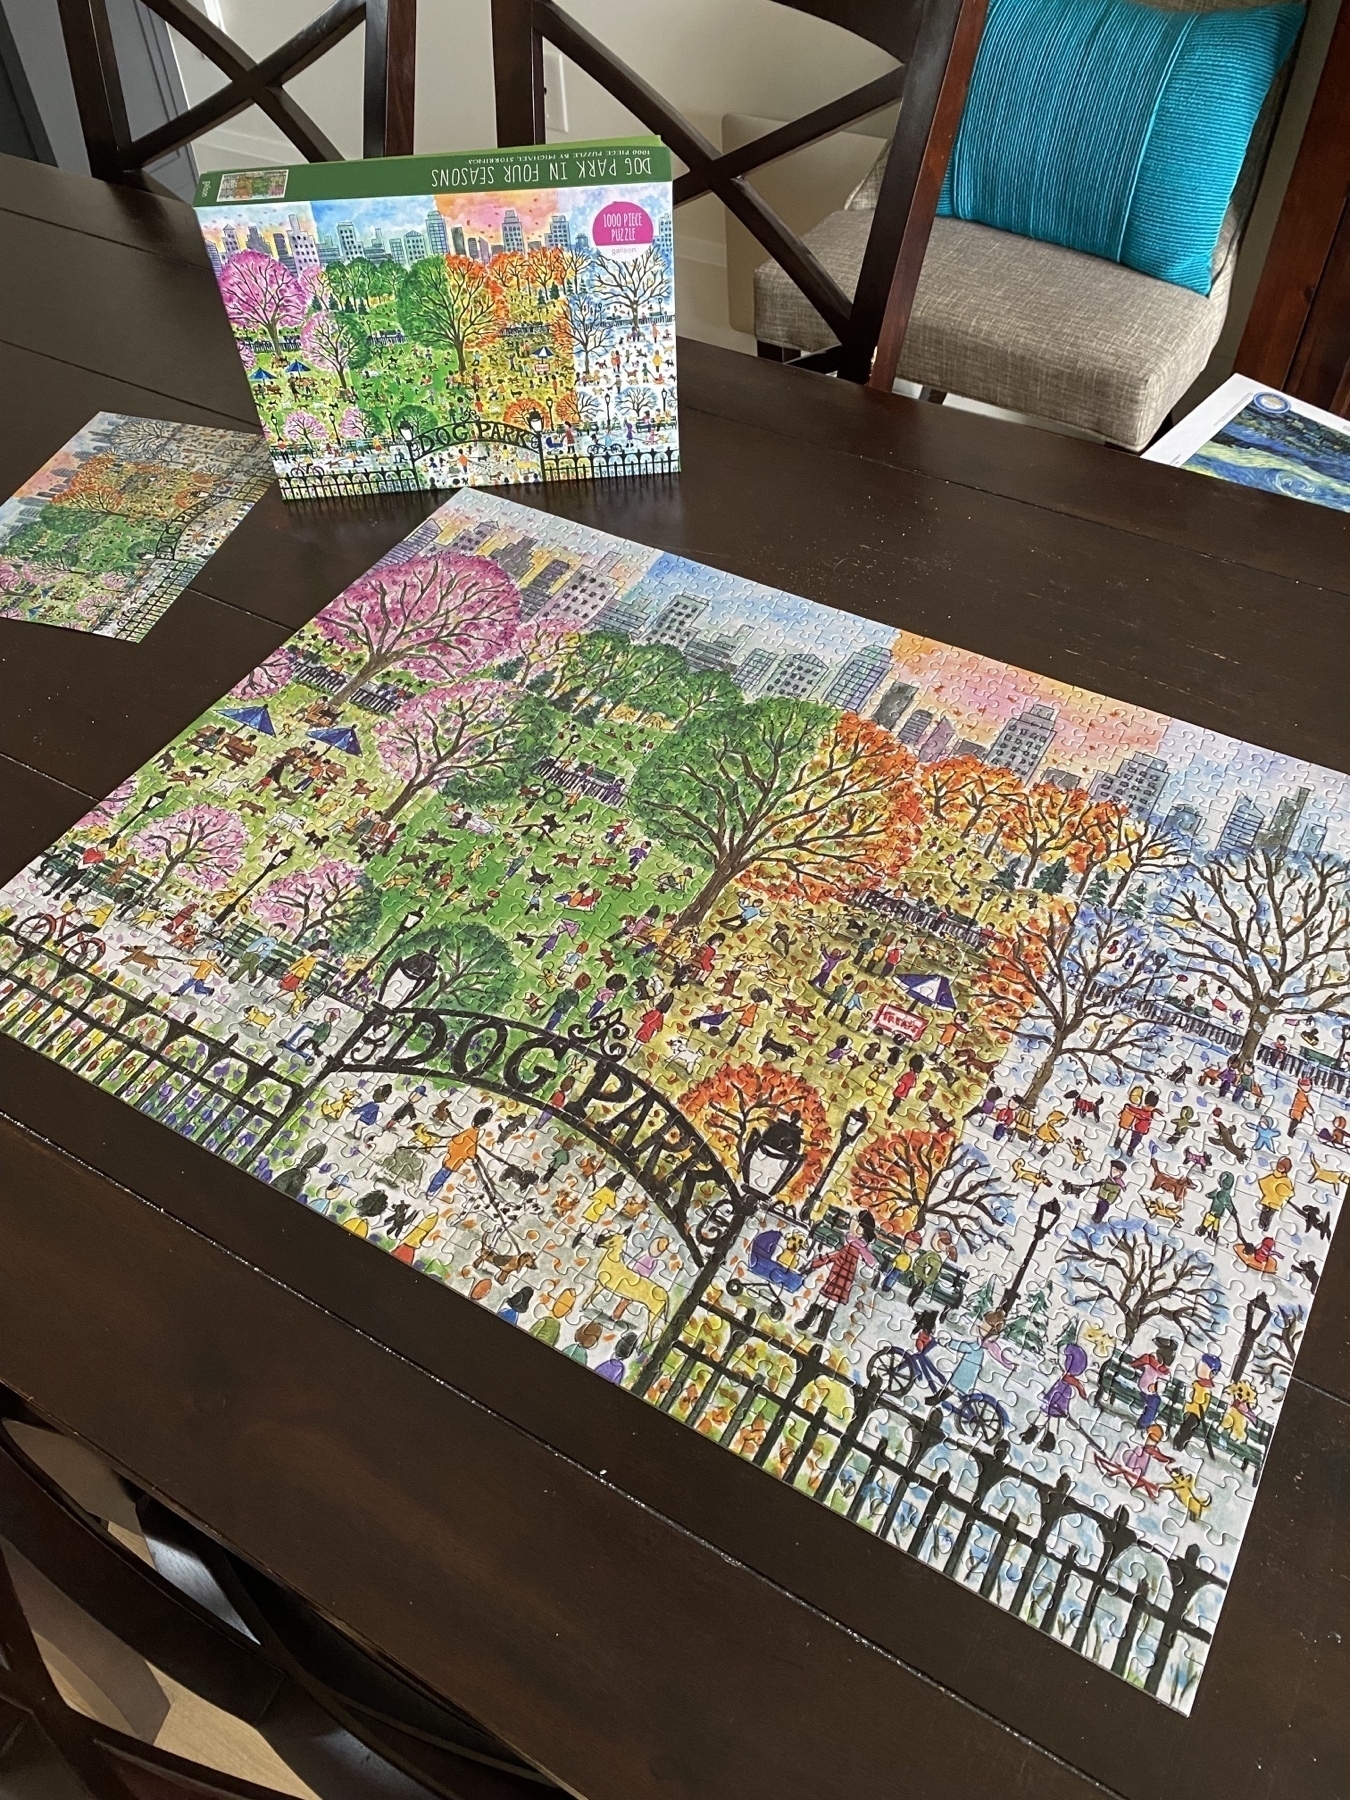
Day 18: No longer random puzzle pieces 📷
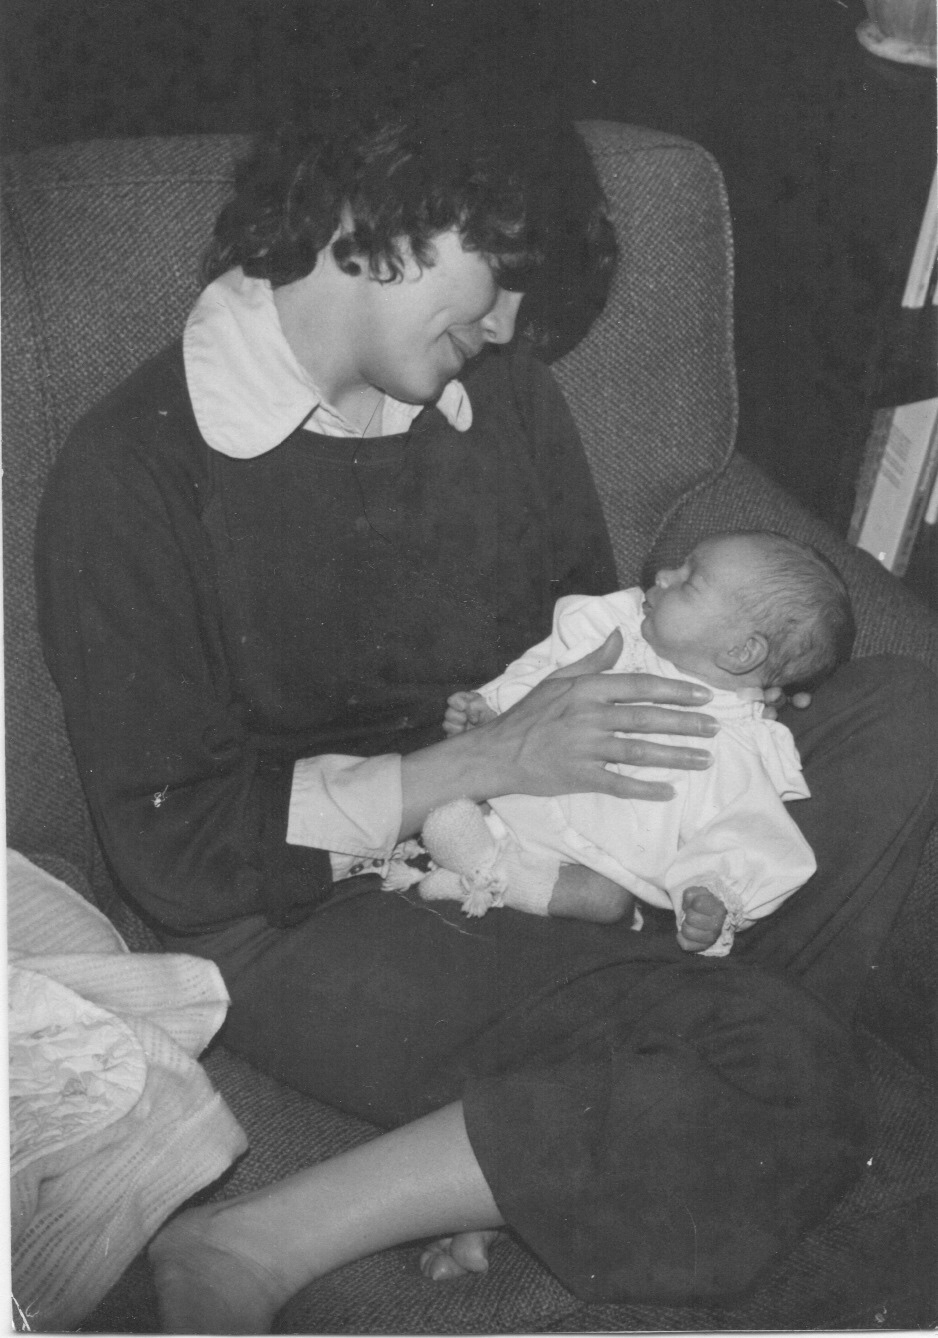
Day 17: Hold 📷
Unwanted house guests
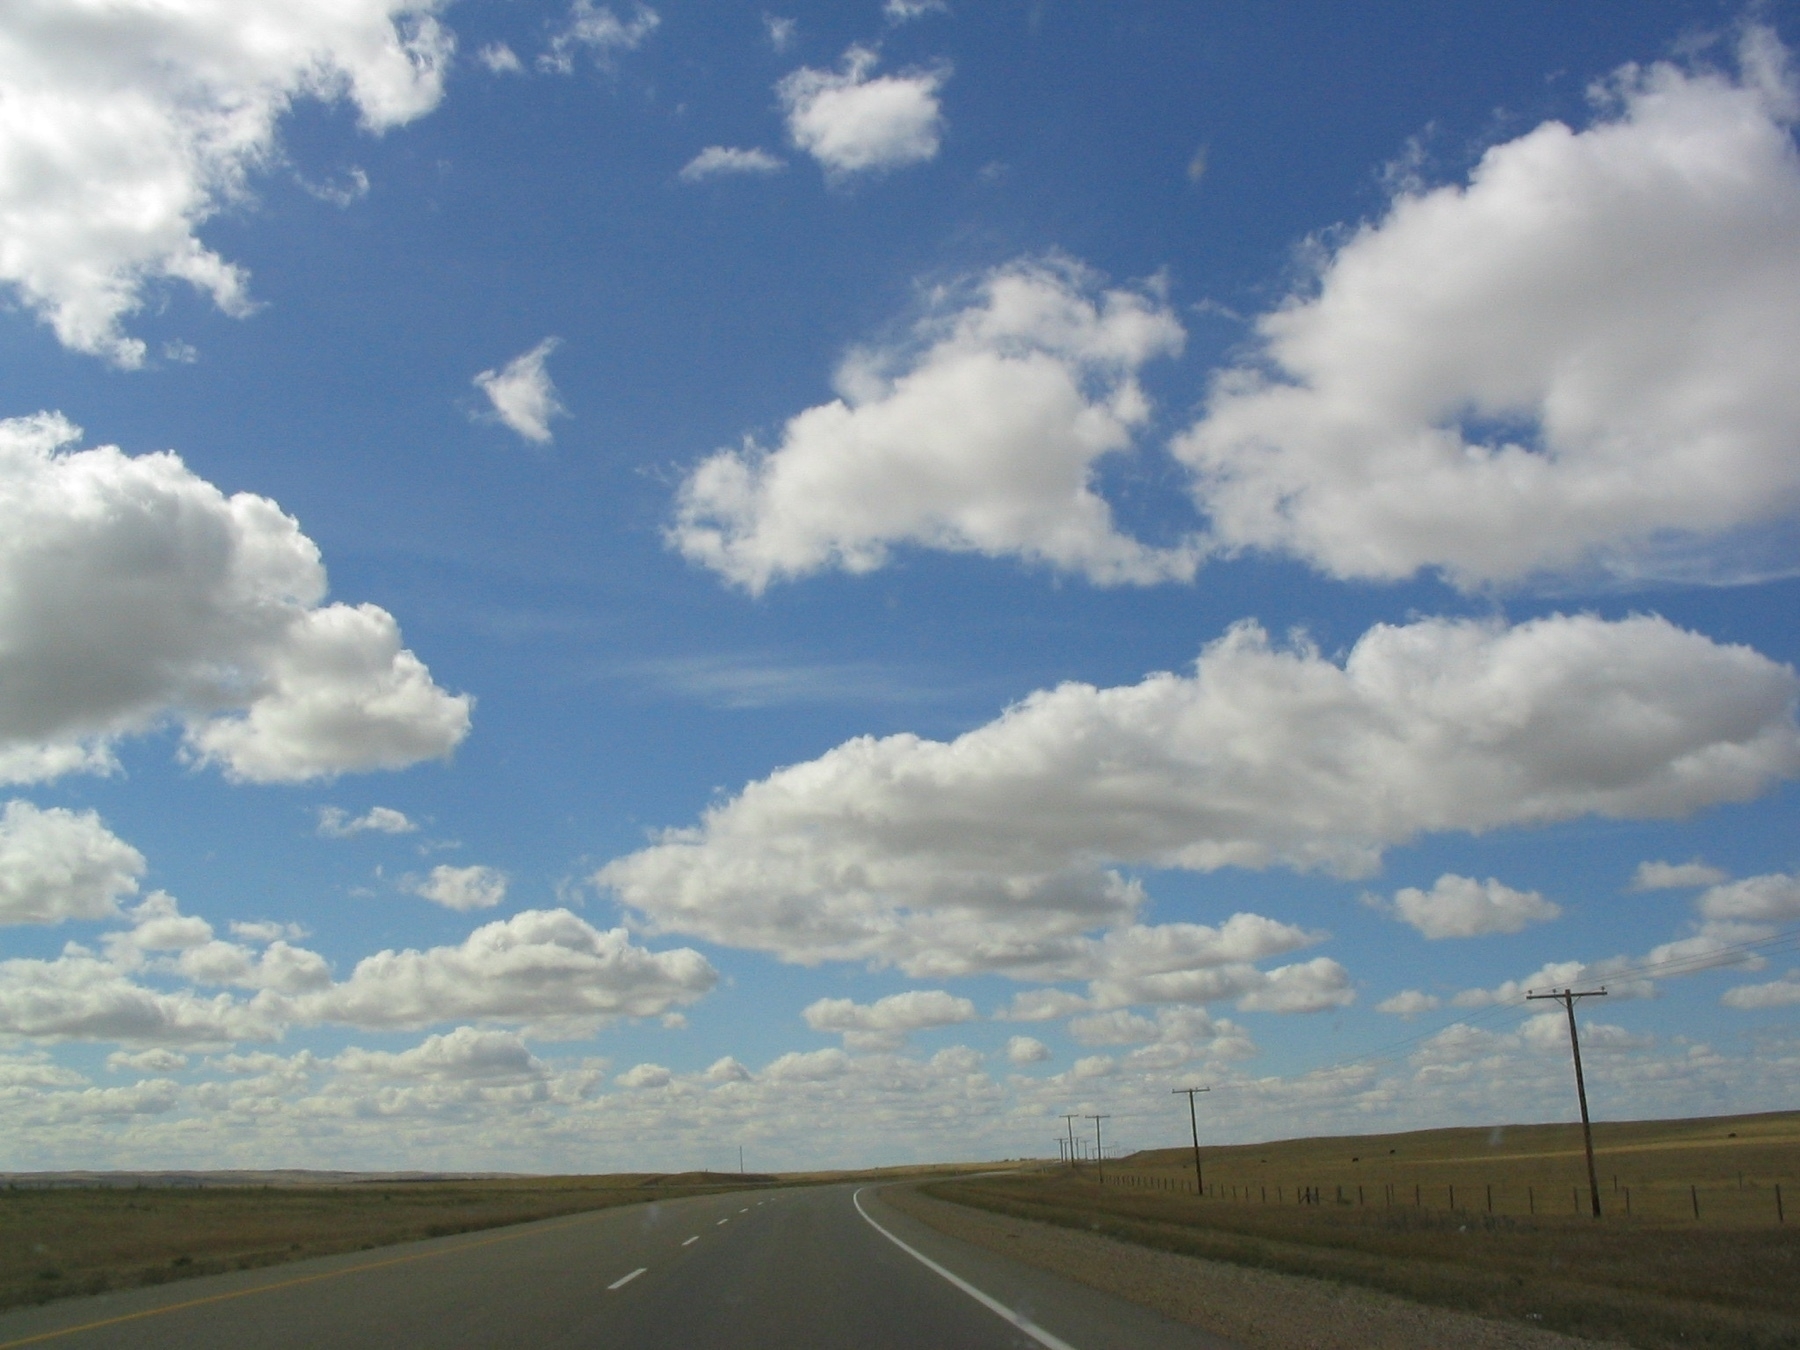
Day 15: Prairie clouds 📷
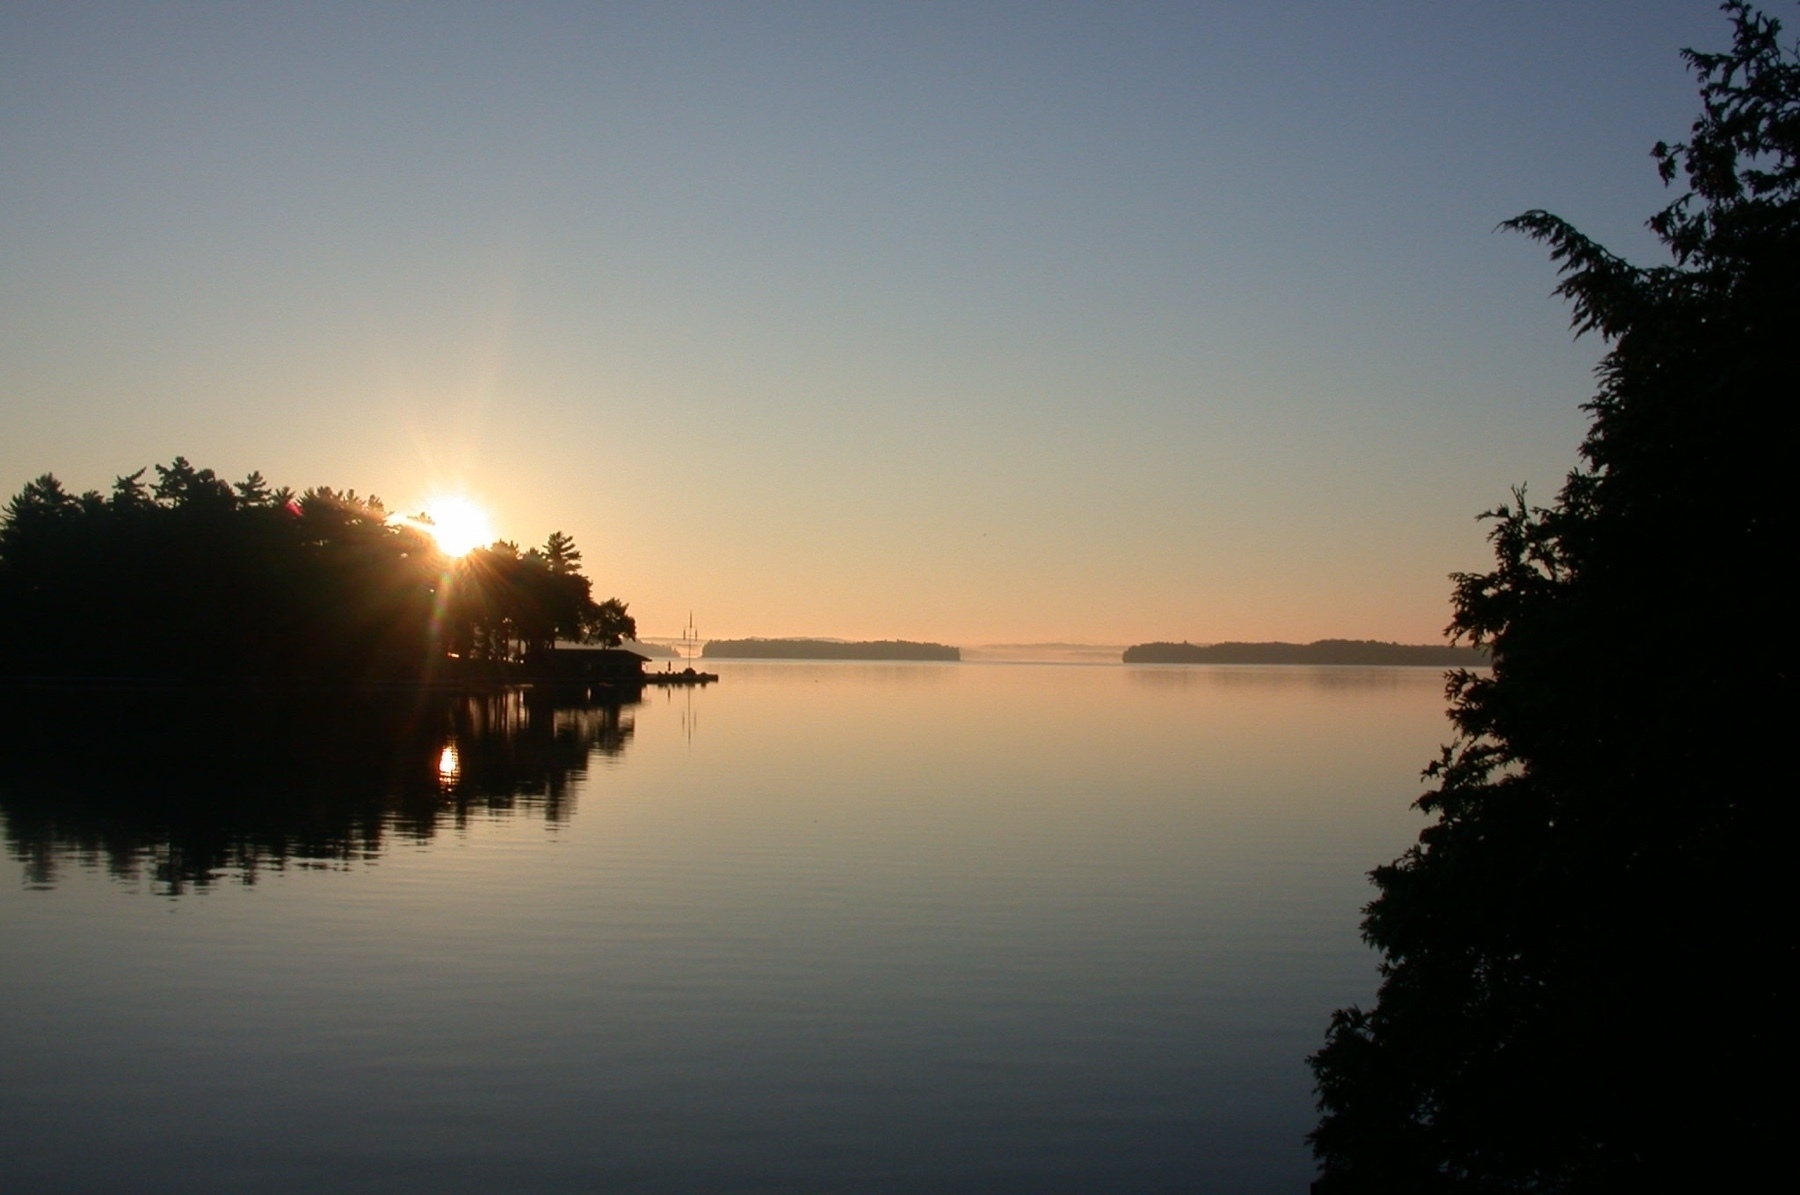
Day 12: Tranquility 📷
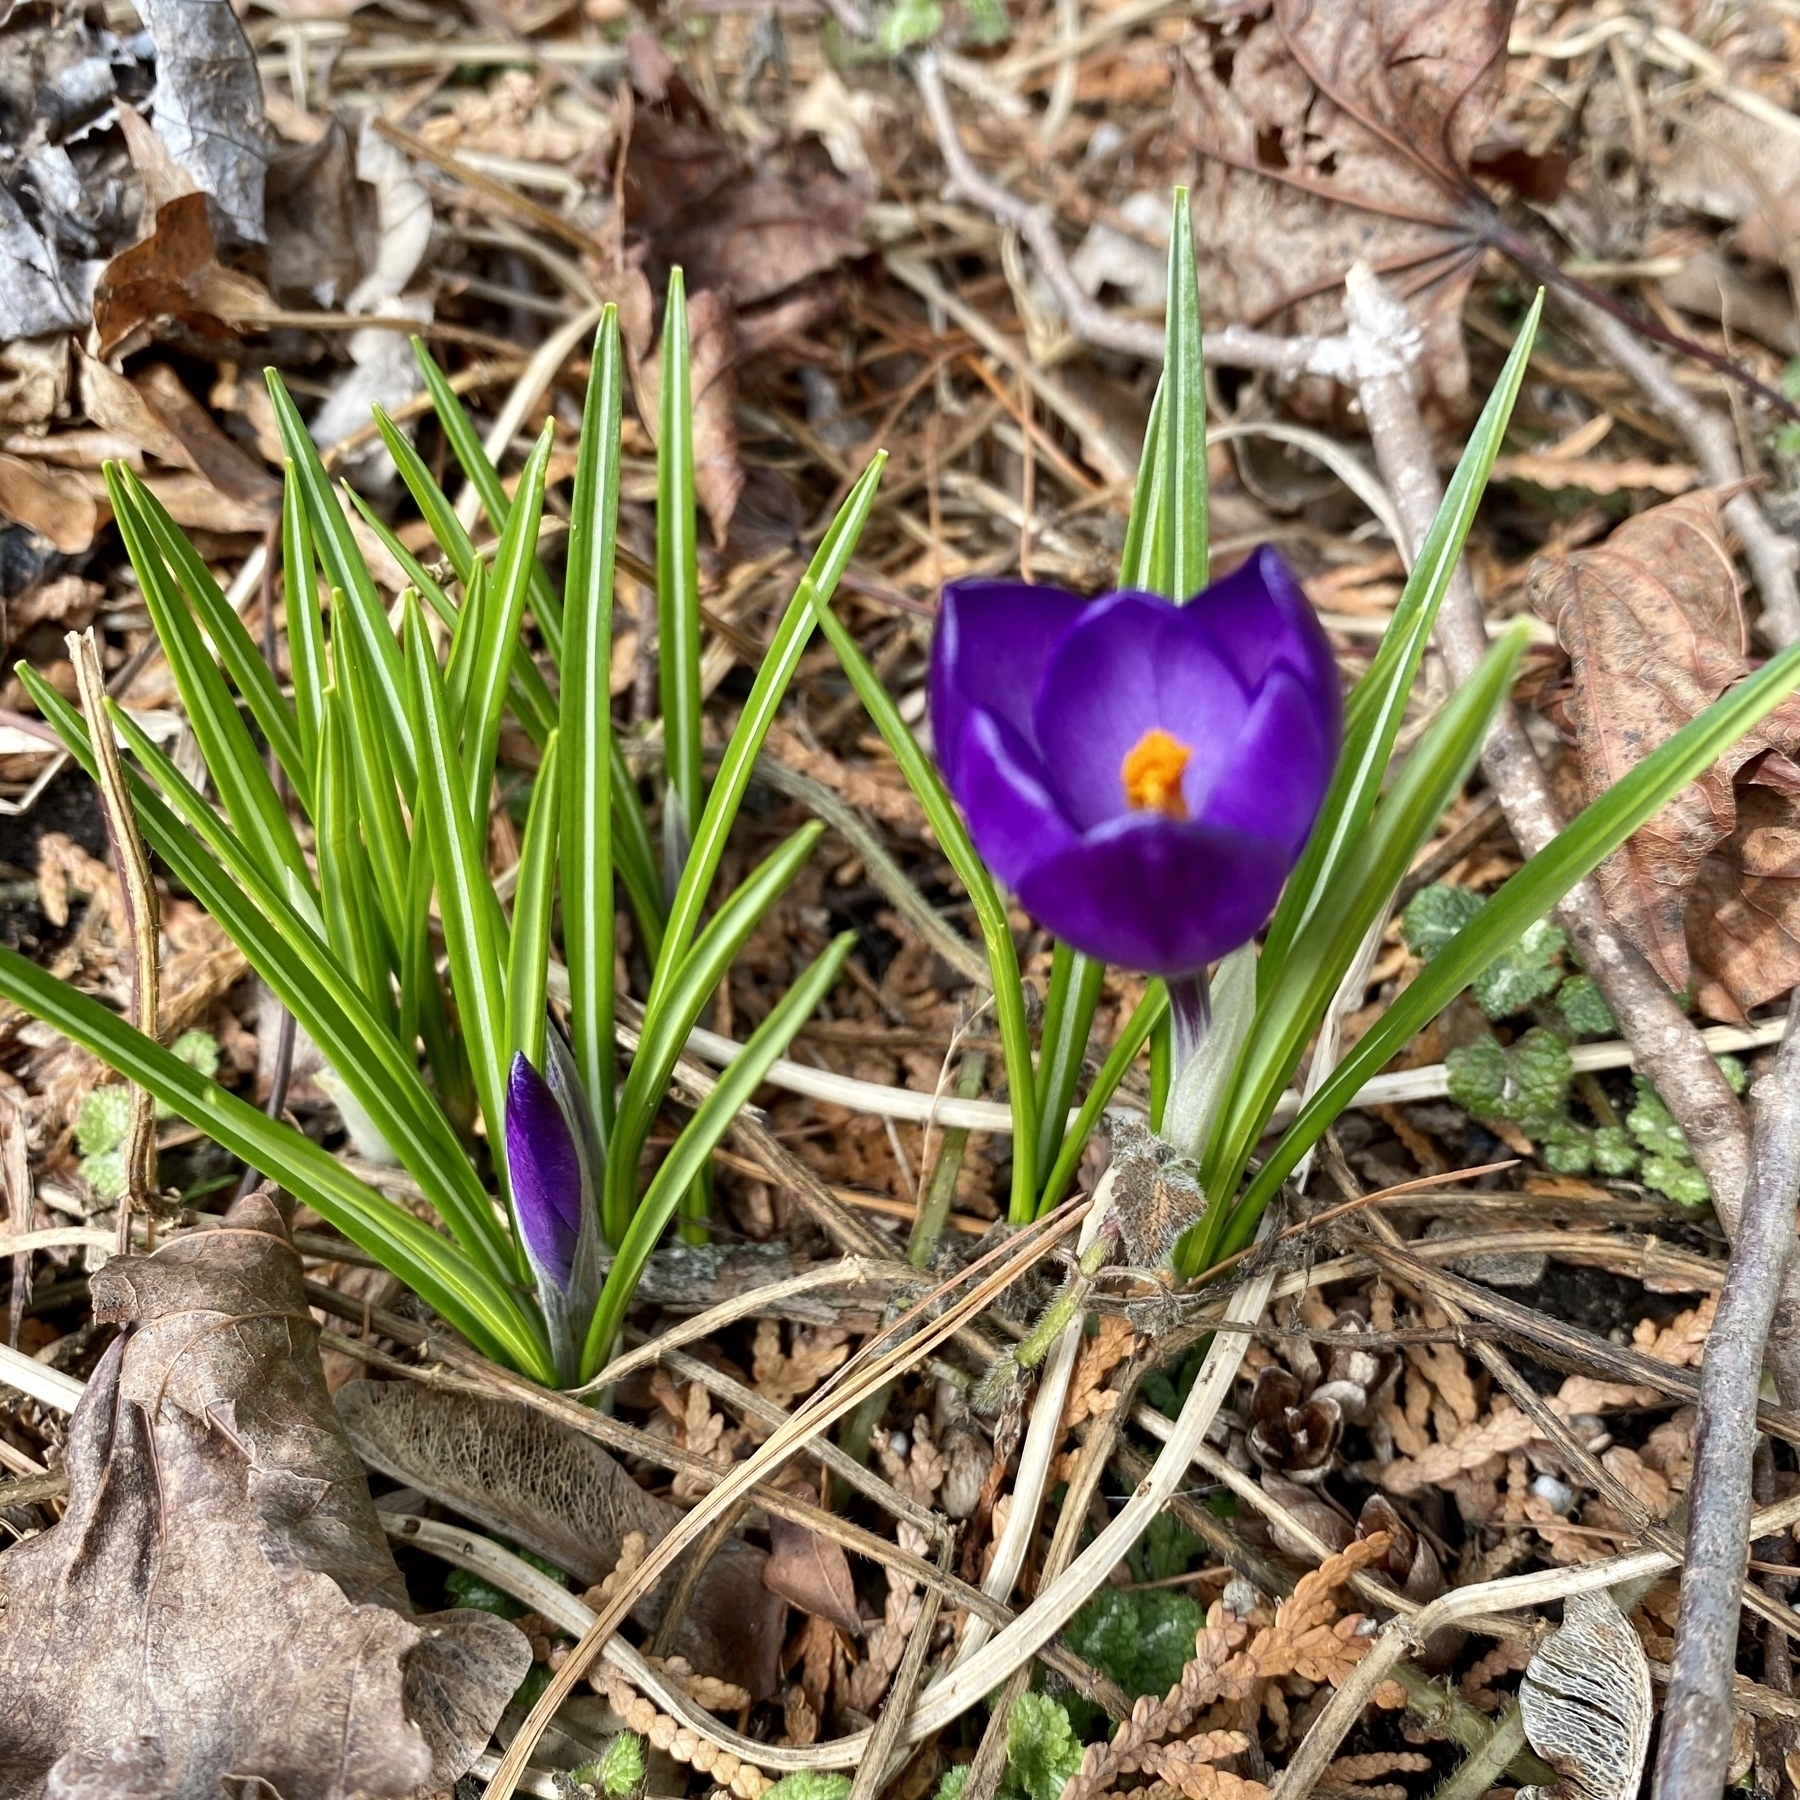
Day 11: Maroon sign of spring 📷
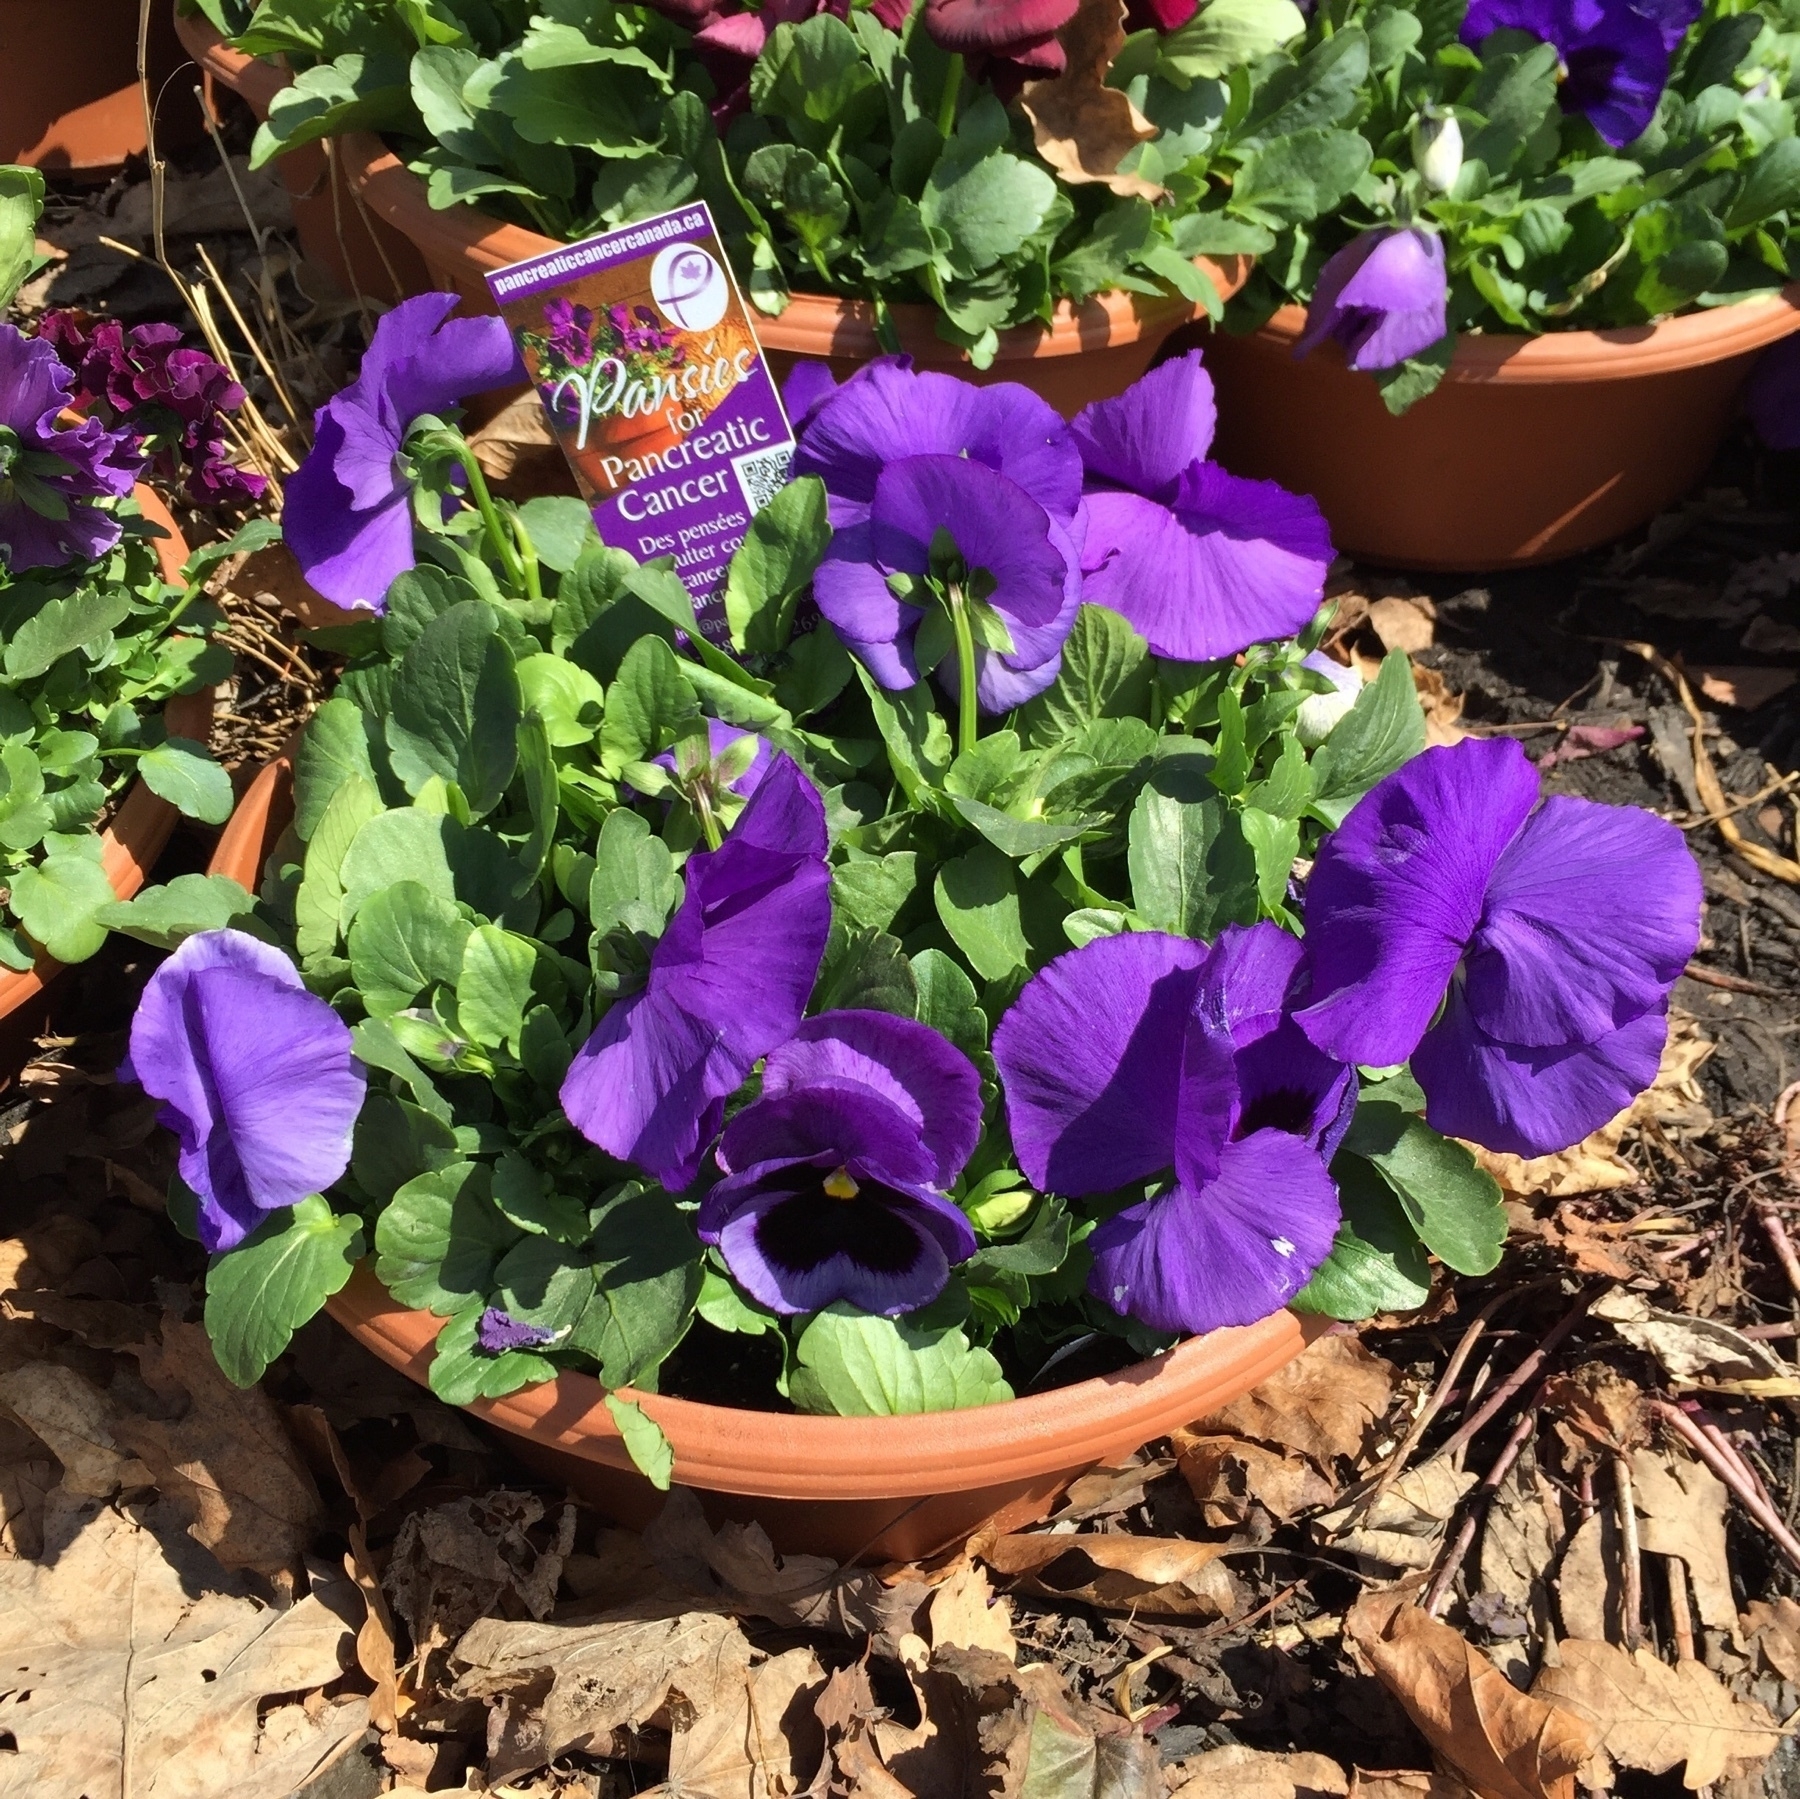
Day 10: For several years, we’ve participated in a fundraiser for Pancreatic Cancer Canada that sells pots of purple pansies 📷
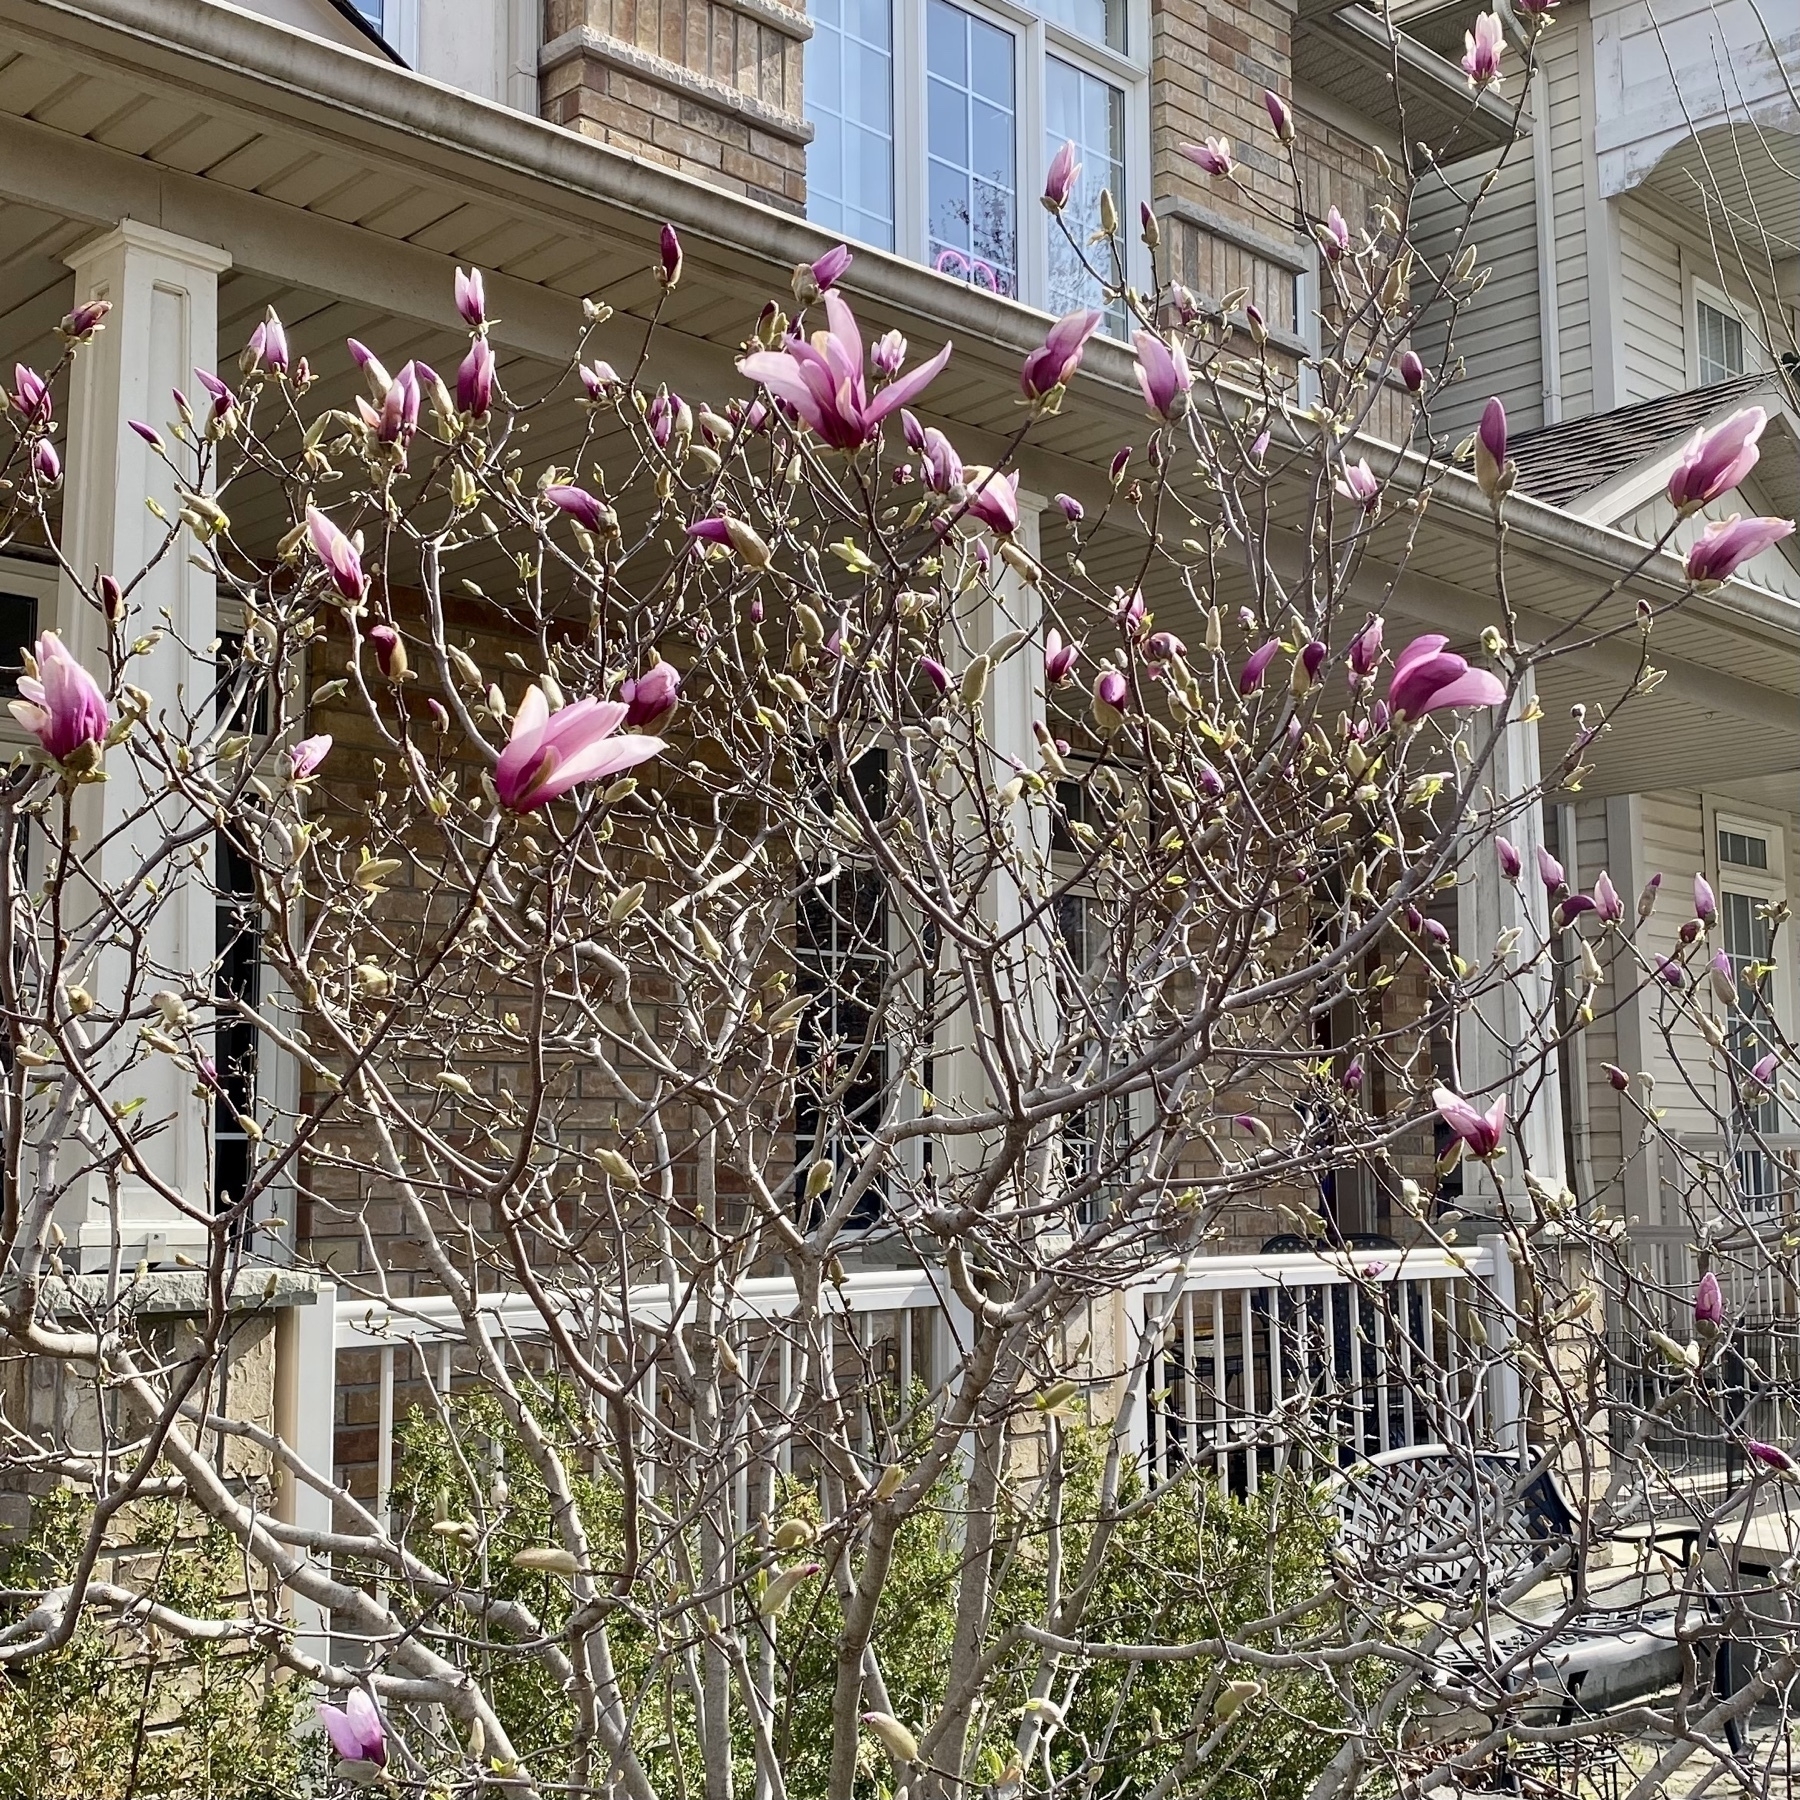
Day 9: Magnolia blooms are imminent 📷
Finished reading: Although surprisingly little actually happens with the plot in Record of a Spaceborn Few by Becky Chambers, the characters and world building are great. Along with fascinating questions about what it means to be human and how to value tradition📚
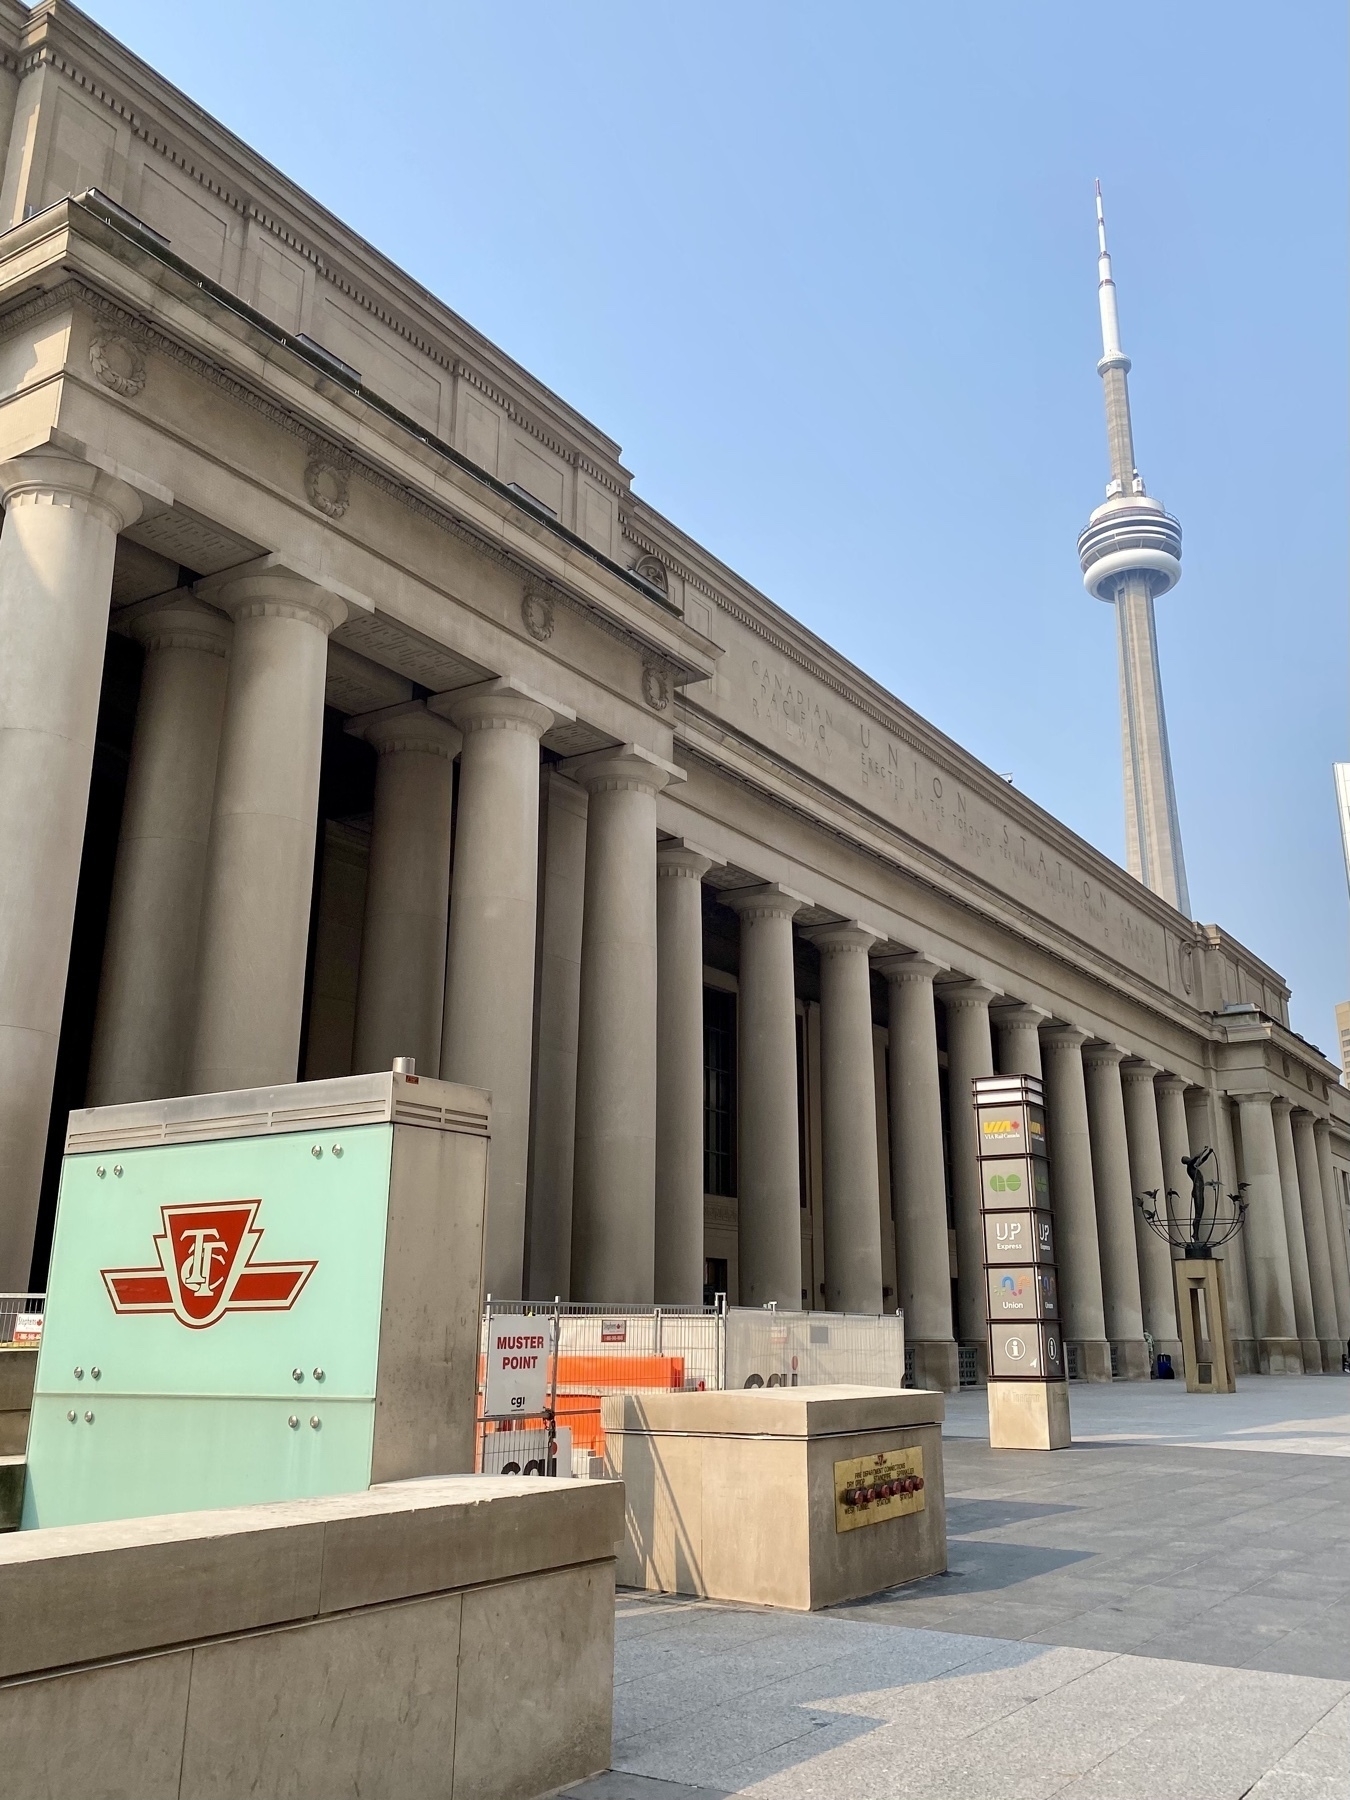
Day 8: Toronto Union Station 📷
First outdoor ride on the new bike. Great to be out of the basement, though I swallow fewer midges on Zwift 🚴♂️
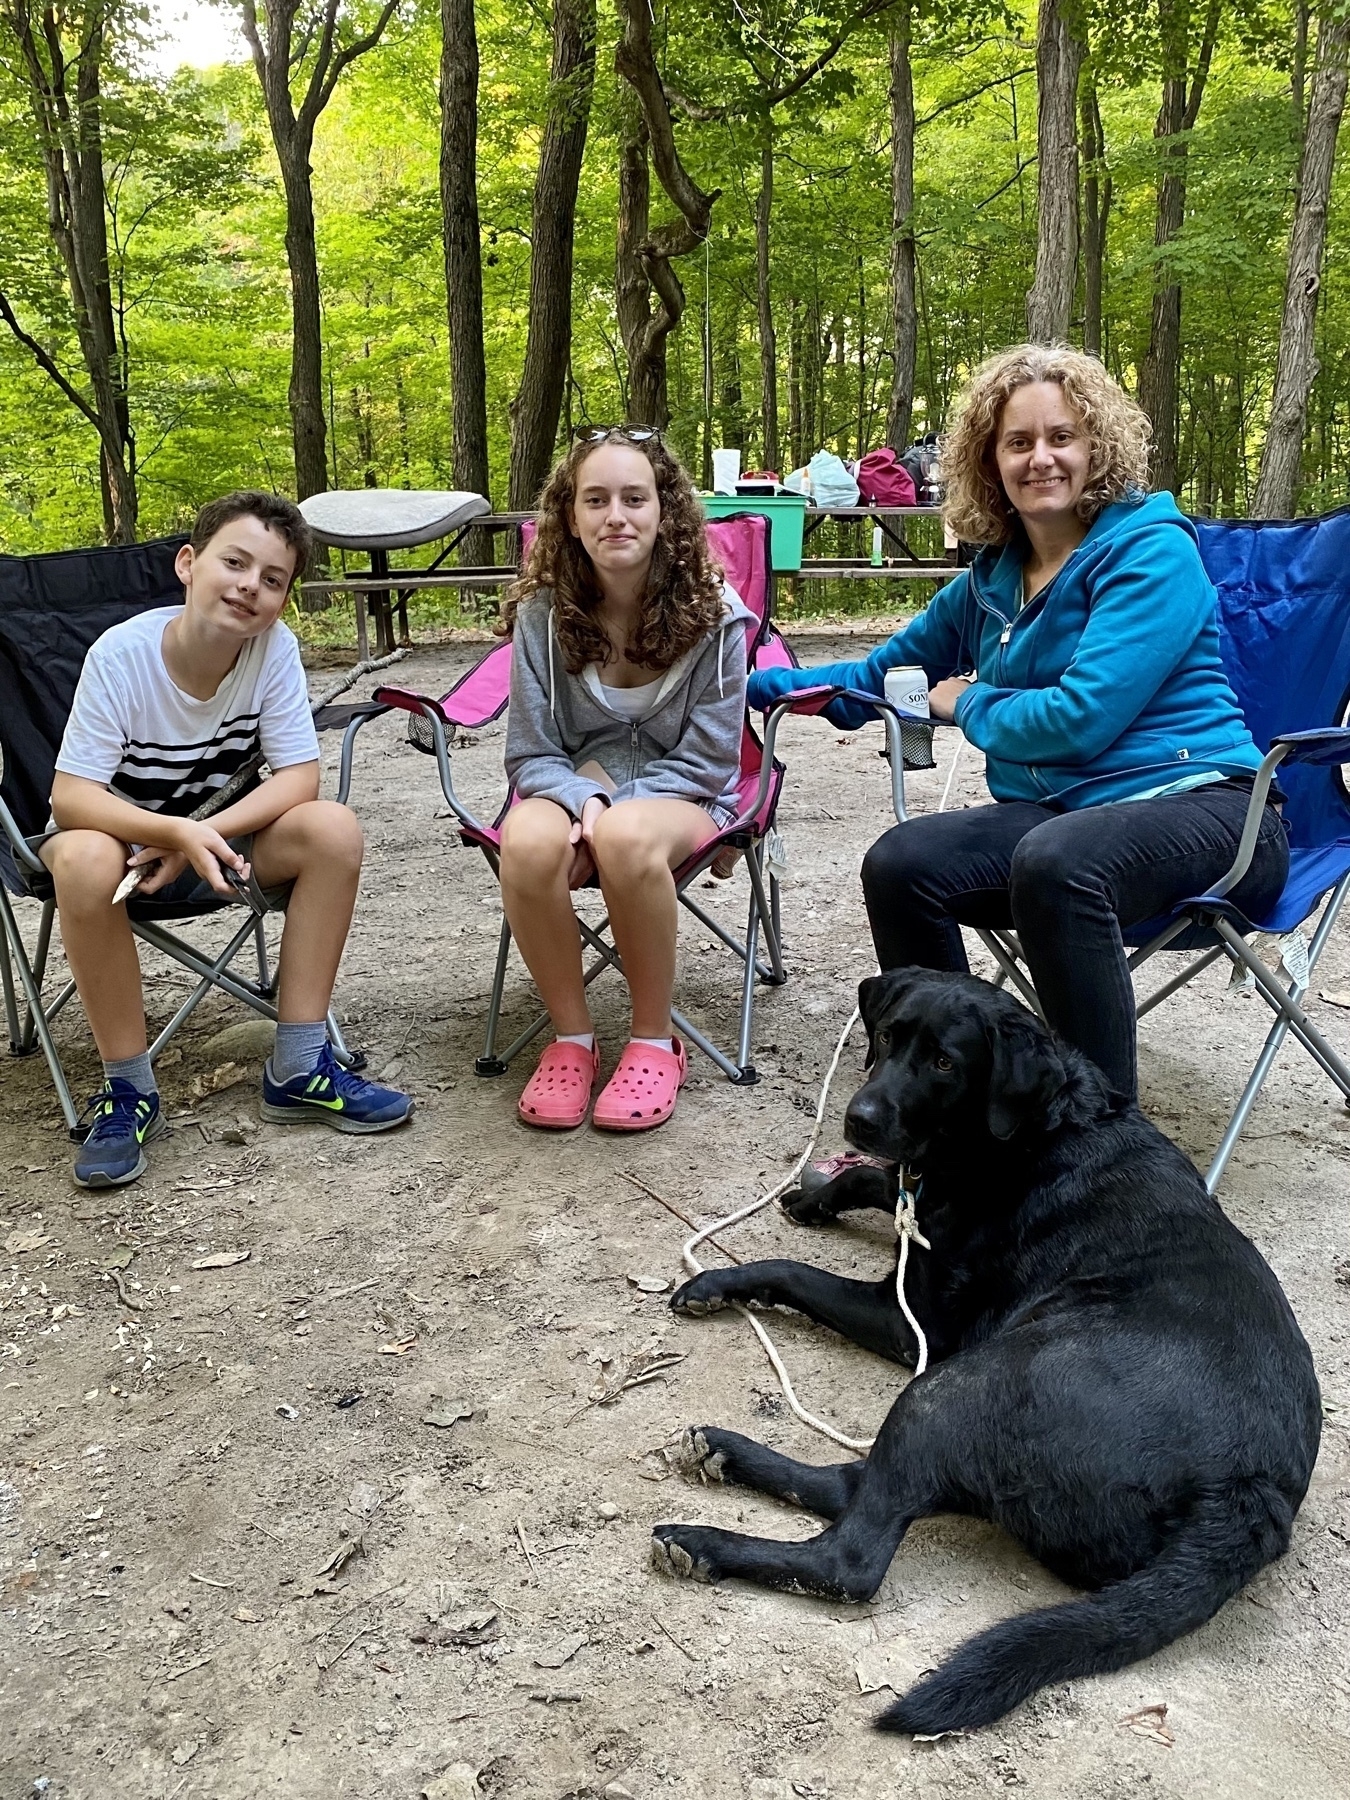
Day 7: We appreciate and enjoy our provincial parks 📷
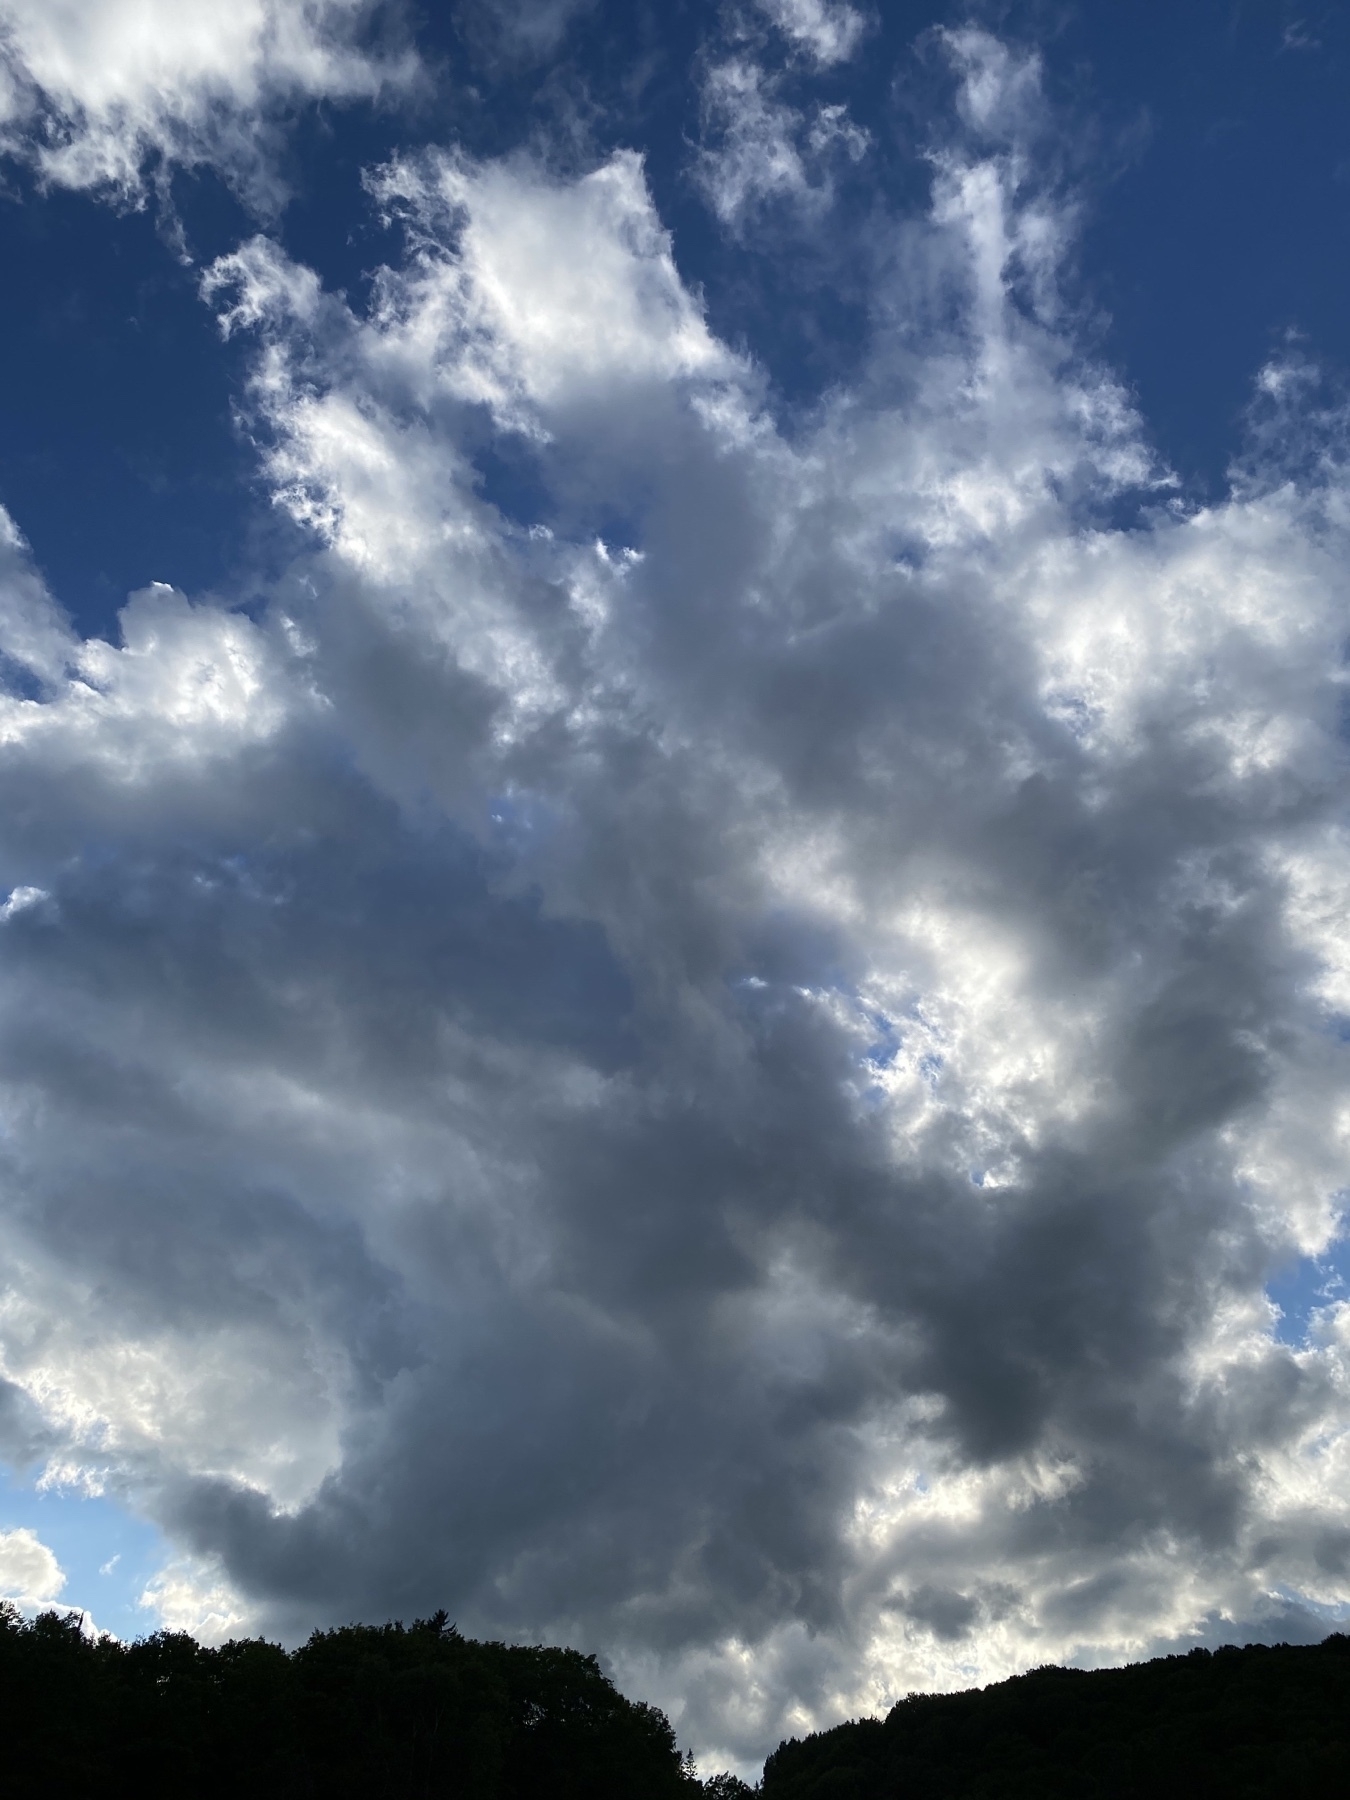
Day 6: Cloud silhouette 📷
Day 5: Earth 📷
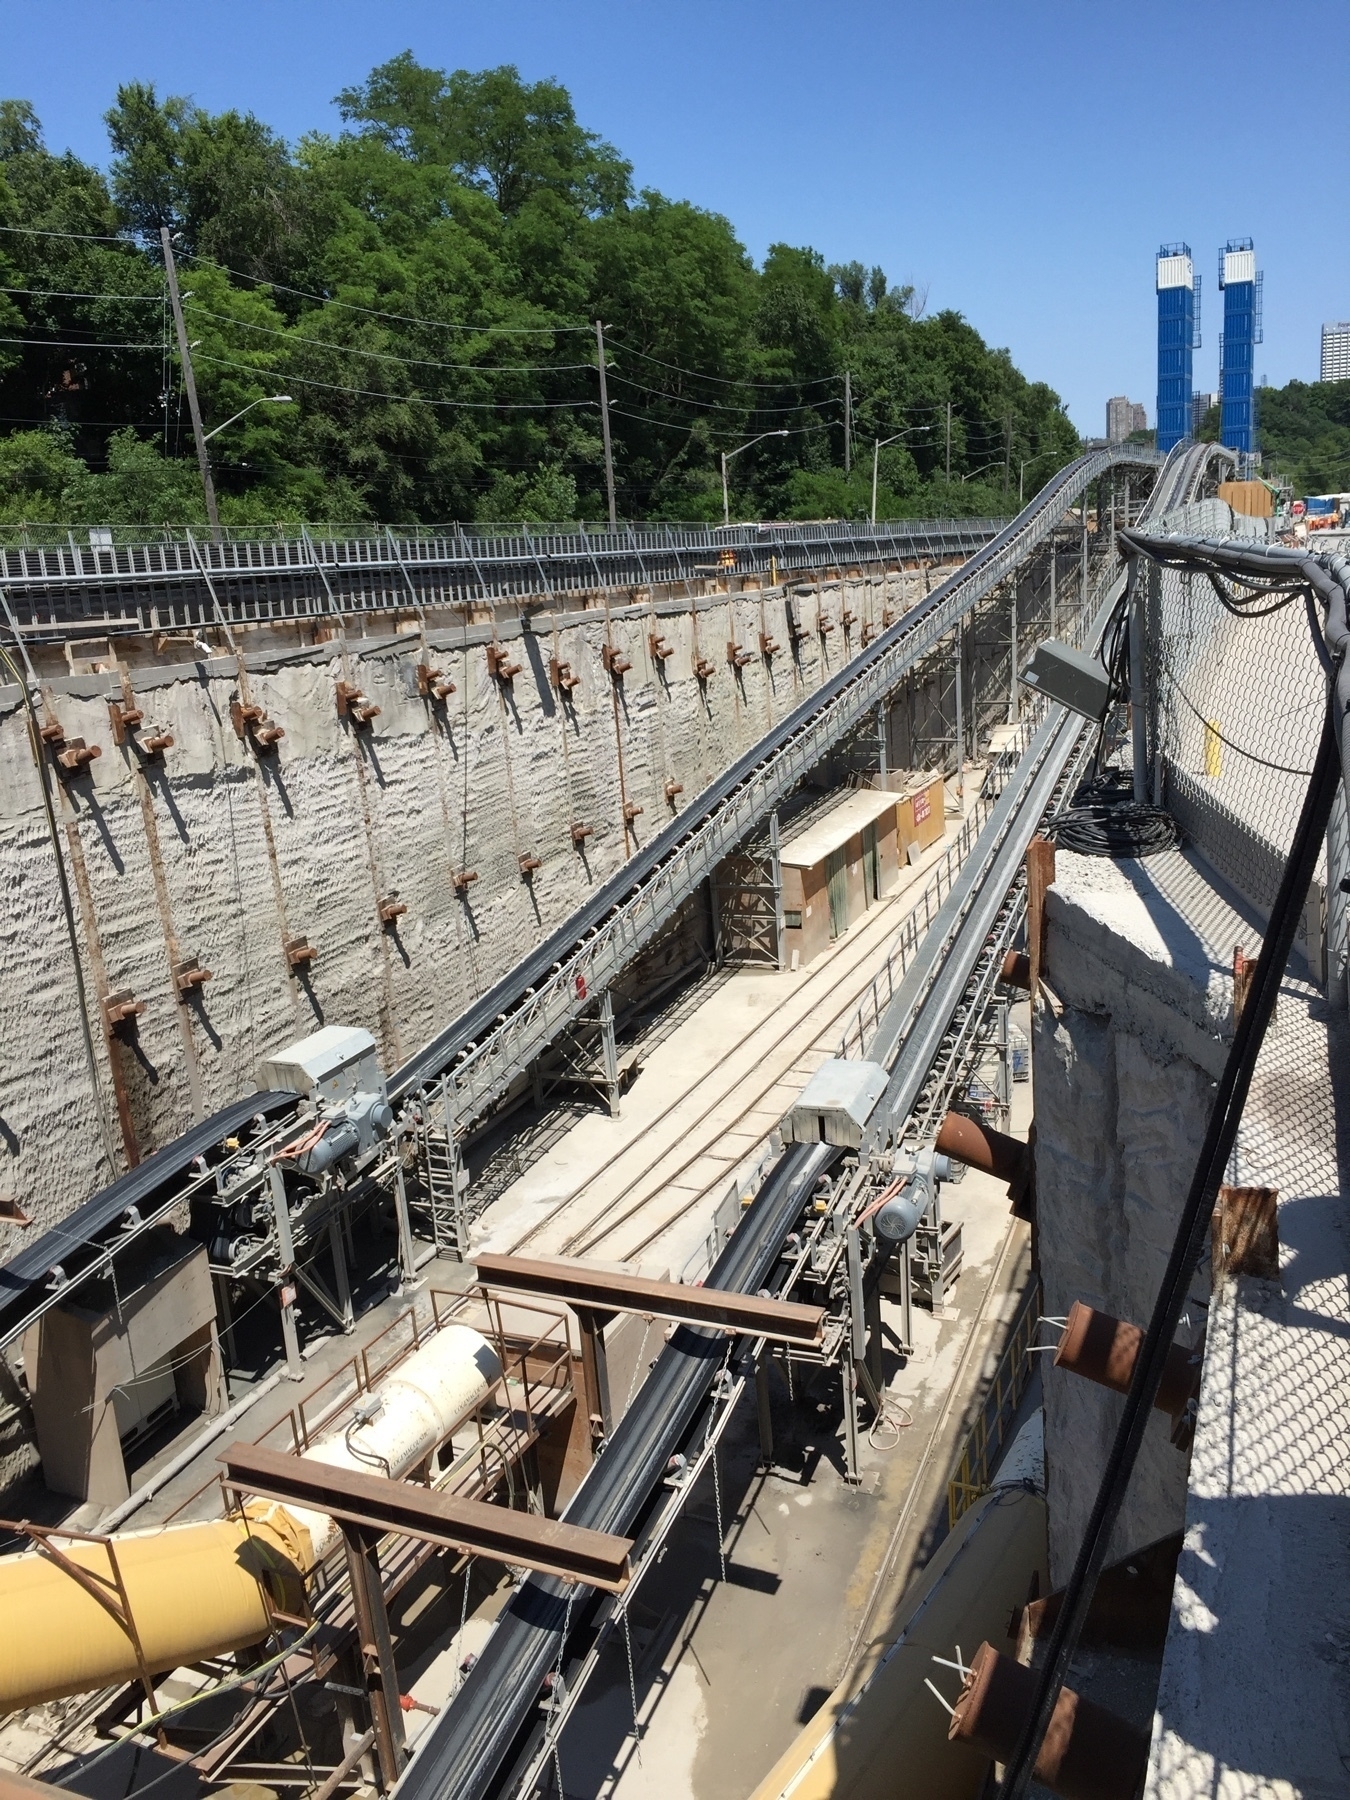
Day 4: LRT tunnelling at _Thorn_cliffe Park (bit of a cheat on the prompt) 📷