🎶 After a last scrobble on Dec 4 2007, I’ve resurrected my Last FM account and connected it to the Albums app. This should encourage me to listen to more complete albums, while also tracking what I’m listening to. I’ll keep using the Apple Music app for those “in between moments” when I don’t have an album queued up
📺 Season 1 of The Peripheral is good. I remember enjoying the book, but not enough of the details to worry about spoilers or notice any changes made in the show
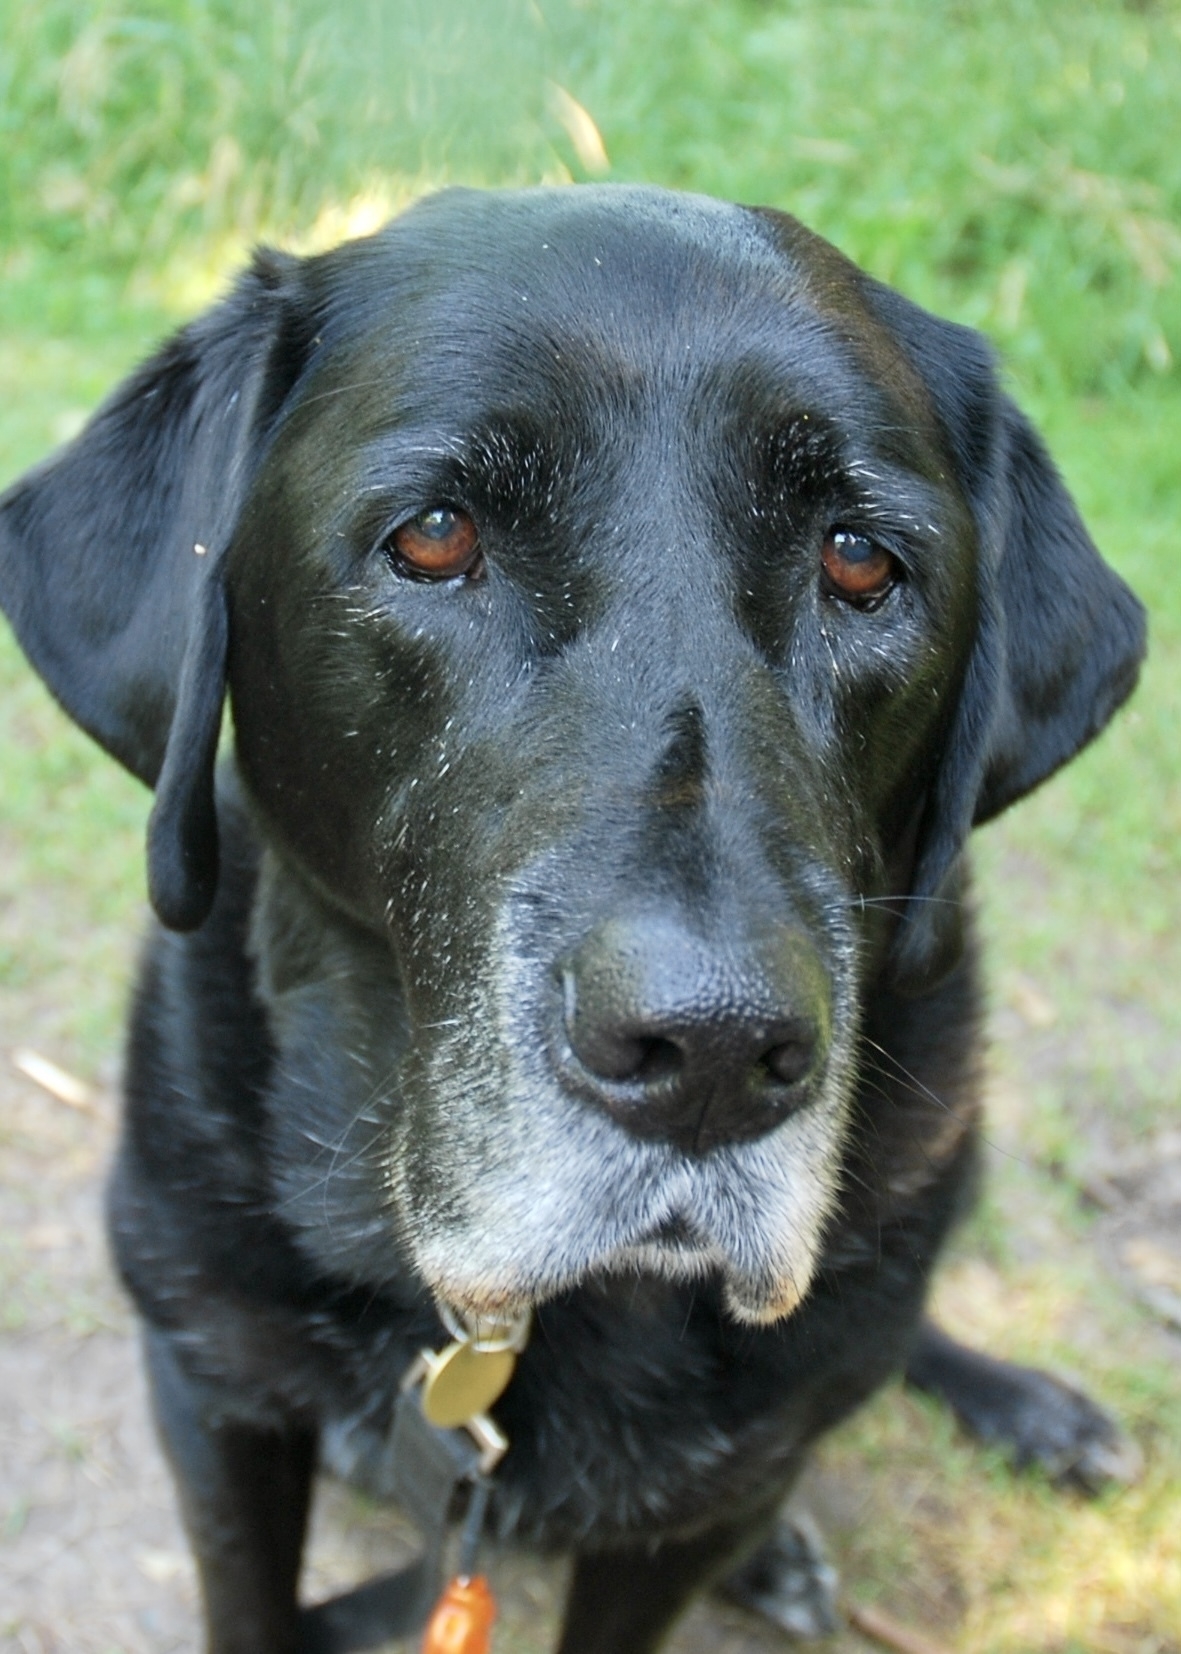
But it was still deeply upsetting. My eyes started to water just writing about it. The good death of a beloved animal who has led a good life is both sad and OK. The inescapability of mortality means we have to accept it but we don’t have to feel good about it.
Reading this brought back memories of our prior black lab, Ceiligh, and our decision to euthanize her once she was diagnosed with significant and incurable cancer.
In addition to everything described in this essay, two other factors made this a very difficult decision:
We made the choice on her behalf. Of course, we made the choice to reduce her suffering, but it was still an active choice for which we were accountable.
Our kids were young enough to not have experienced much loss yet, while also old enough to understand what was happening. Explaining to them why this was the best outcome was difficult.
We valued Ceiligh’s role in our family and welcomed her predecesor, Lucy, knowing that the choice might arise again, while also knowing how much she would enrich our lives.
Finished reading: The Biggest Ideas in the Universe by Sean Carroll. I really appreciated this book. Starting from high school math, Carroll leads you through 200 crisp and entertaining pages to actually show you how to derive Einstein’s Theory of General Relativity. A nice middle ground between the analogies of popular science books and the intense detail of a text book. I’m looking forward to the next book in the series. 📚
Currently reading: All the Math You Missed by Thomas A. Garrity. I’m looking forward to this challenge 📚
Finished reading: Life Is Hard by Kieran Setiya is a good, pragmatic book about how philosophy can help you navigate difficult times. I appreciate Setiya’s easy going style and his approach is a good complement to Oliver Burkman’s practical advice 📚
I was going to say Hussen should table one of two things: every piece of communications material that was ever produced for him by Munch More Media, or his resignation from the government. But I’m not sure why we can’t have both.
Indeed
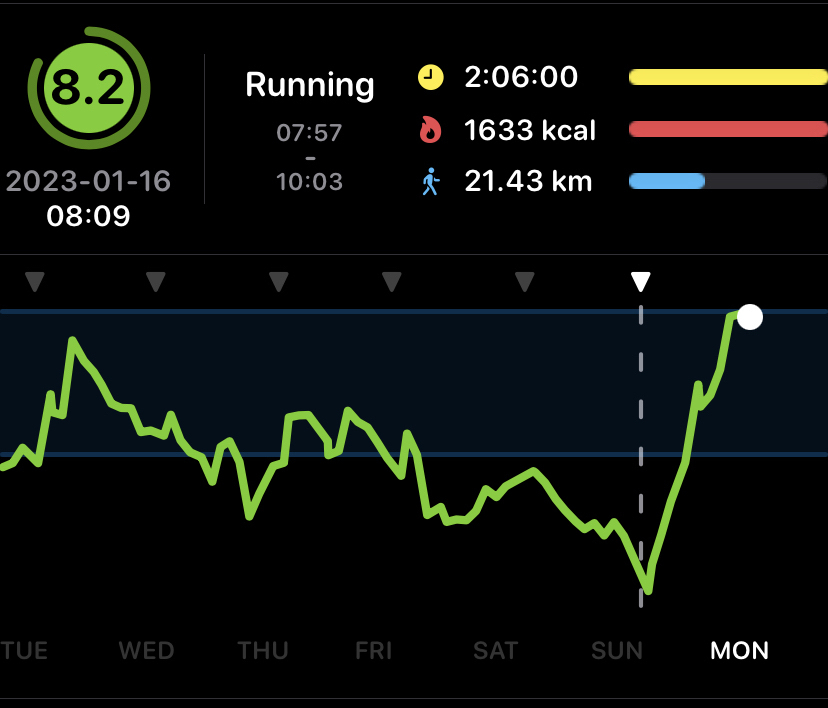
🏊♂️🚴♂️🏃♂️ I’ve cancelled my Strava subscription. This isn’t directly caused by the price increase (though a 100% increase is big!), rather this was a good reason to reconsider the service. Most of the Strava features that I’ve found useful (detailed analytics for the most part) I can also get from the built-in Apple Fitness metrics, augmented by the HealthFit app. So, I’m not seeing the value in keeping the subscription. I’ll keep using the app, though, since I do appreciate the social aspects of the service.
Articles like “We will never be able to live on another planet. Here’s why” highlight an important tension. As a fan of science fiction, I’m really excited by the prospect of space exploration and agree that, eventually, we need to find additional places to live and thrive.
But:
Astronomical observations and Earth’s geological record are clear: the only planet that can support us is the one we evolved with. There is no plan B. There is no planet B. Our future is here, and it doesn’t have to mean we’re doomed.
And, so, we need to take much better care of our planet. There’s lots of excitement here too: clean energy, resilient infrastructure, better agriculture. Along with some real existential dread and disapointment with our behaviour so far.
I like to think we can do both of these things: explore beyond our planet, while taking good care of what we have. Sometimes the balance seems off though.
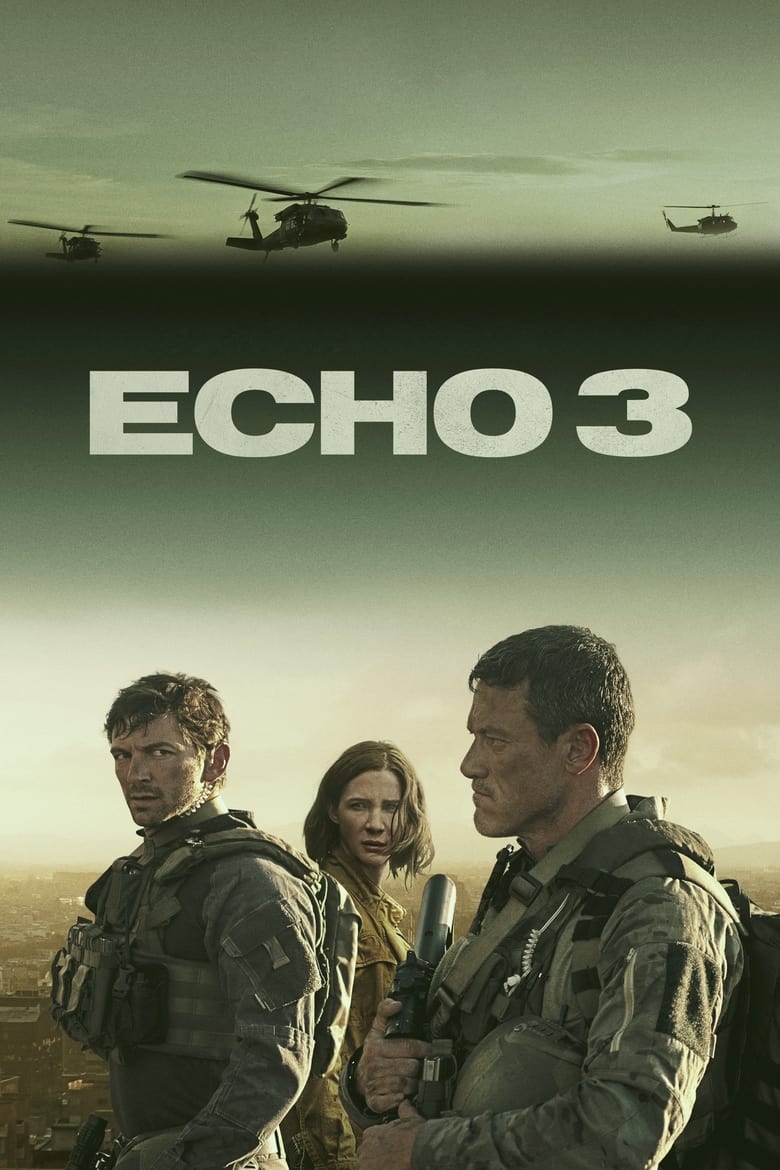
Decent entertainment: well made and acted. The story was relatively straightforward, until the last episode, which started to hint at trauma and consequences.
Not quite as good as season 1, though still entertaining and outrageous
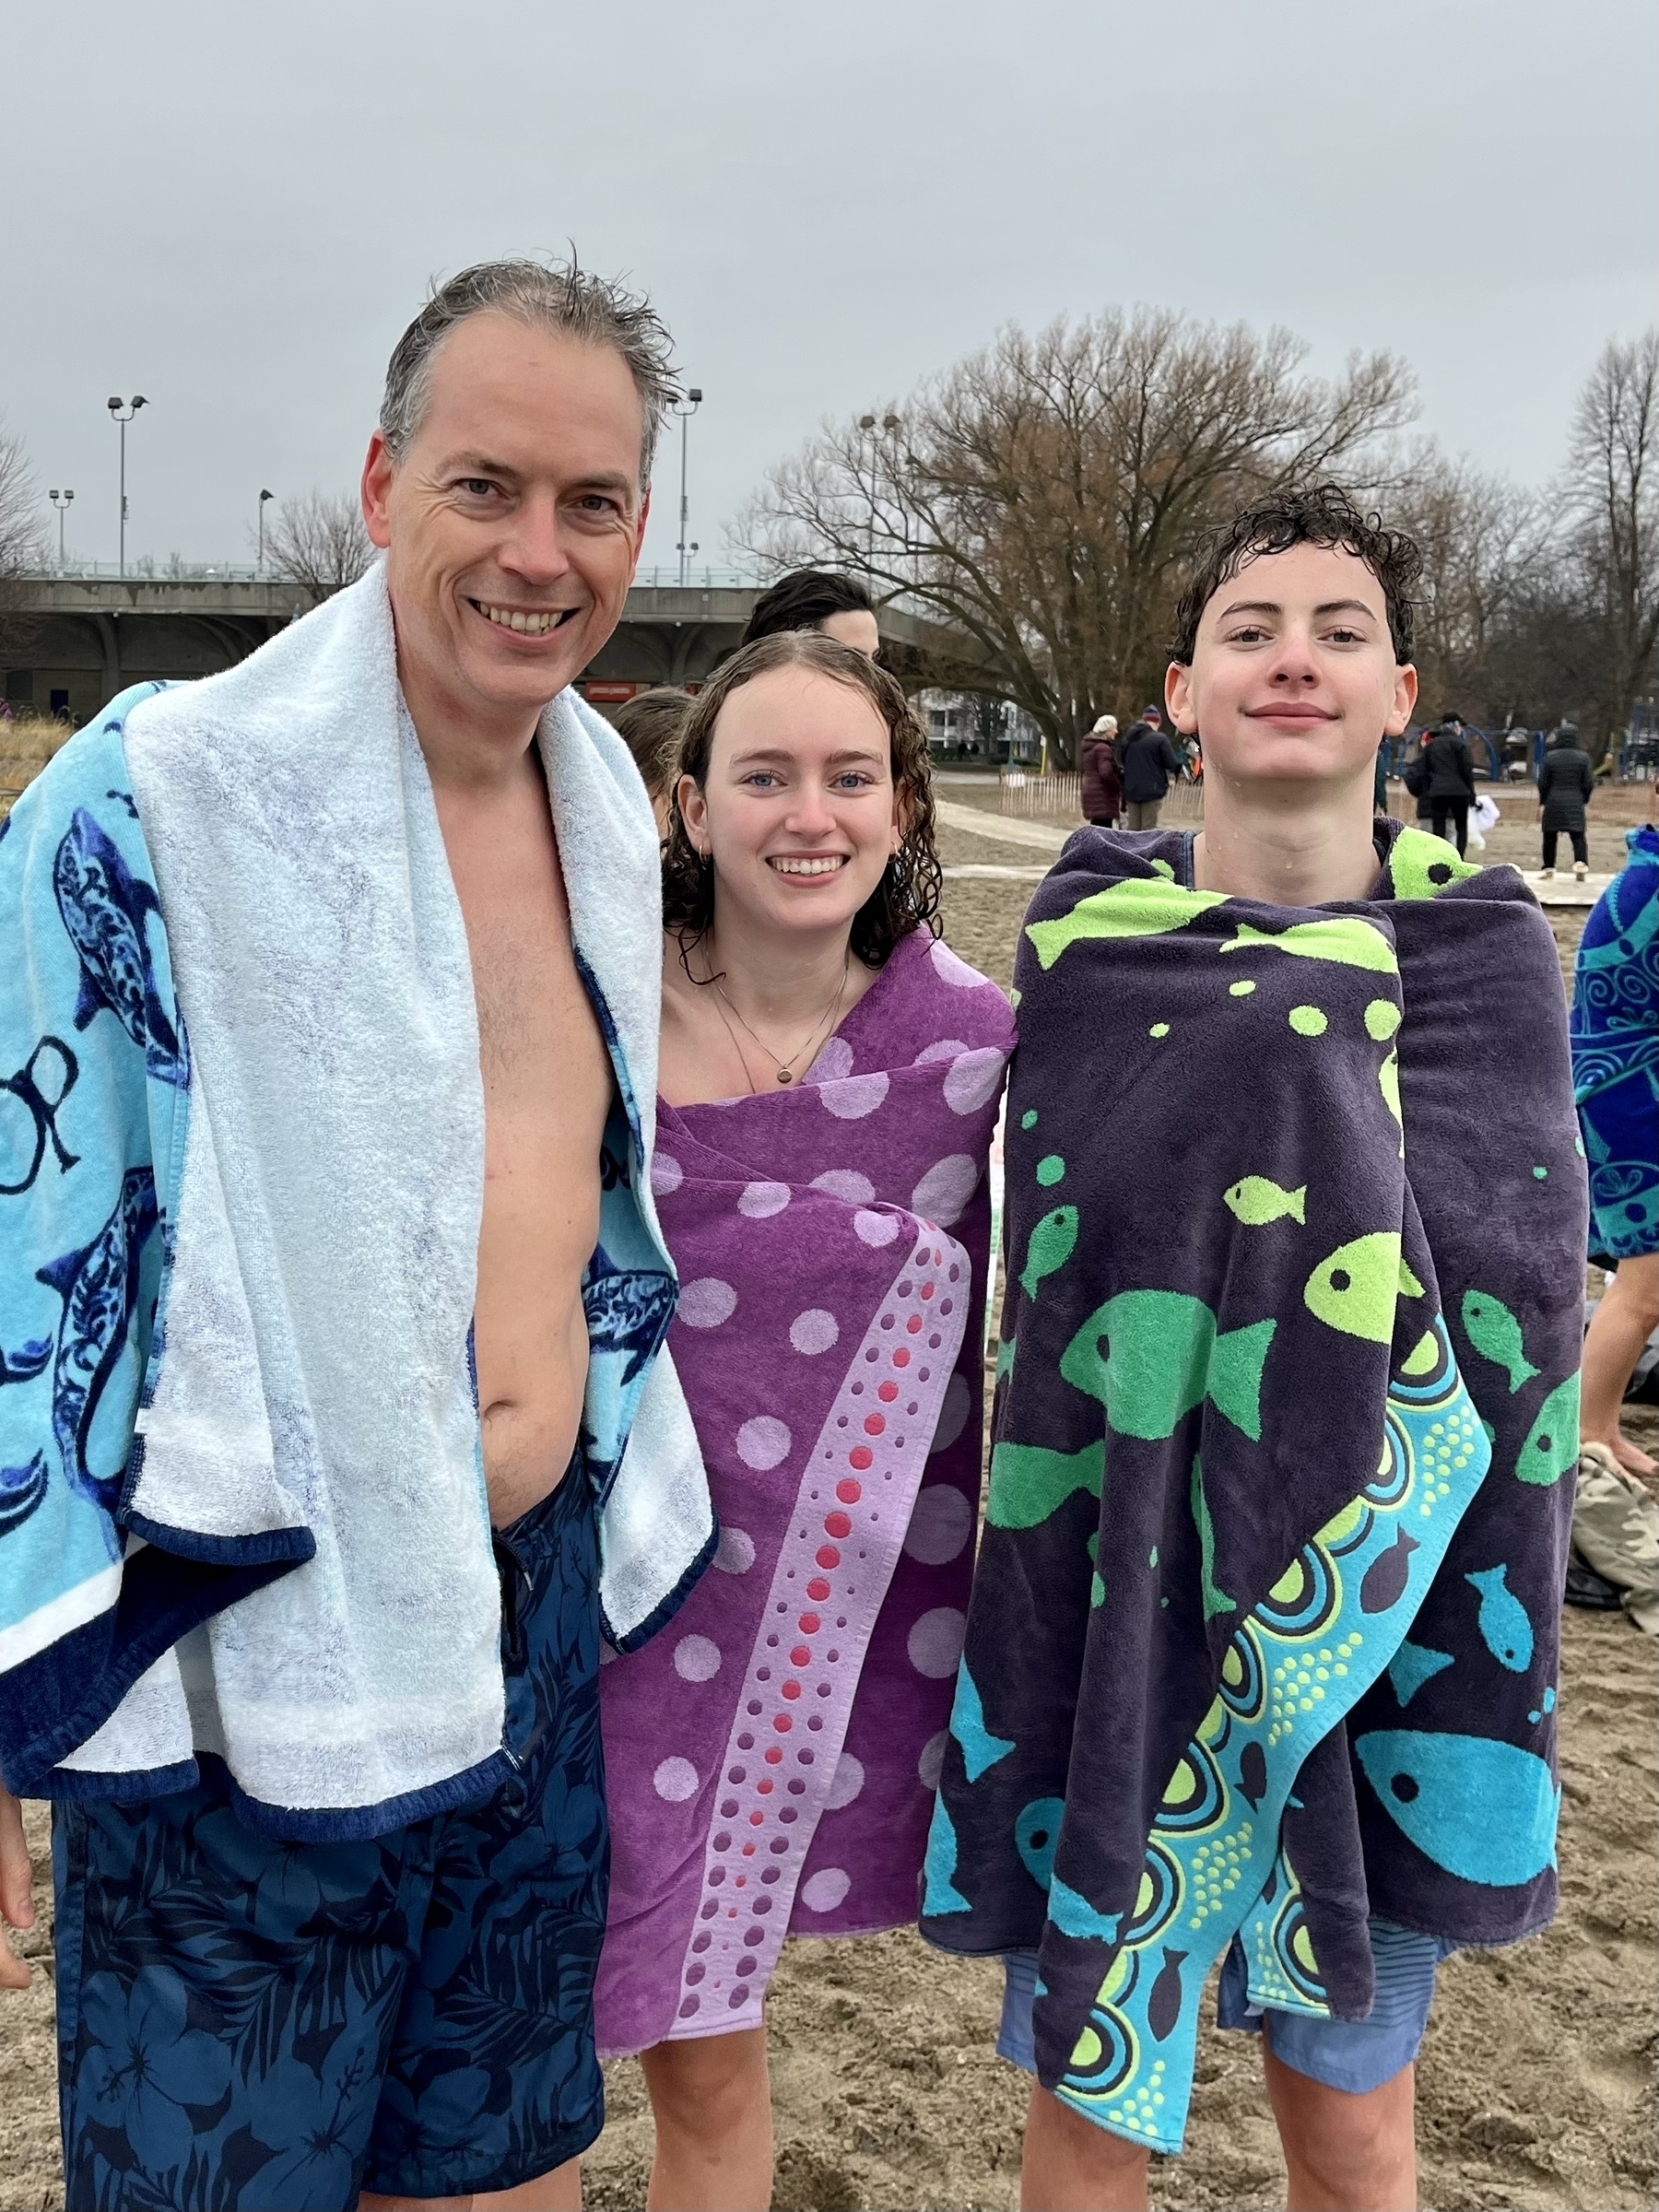
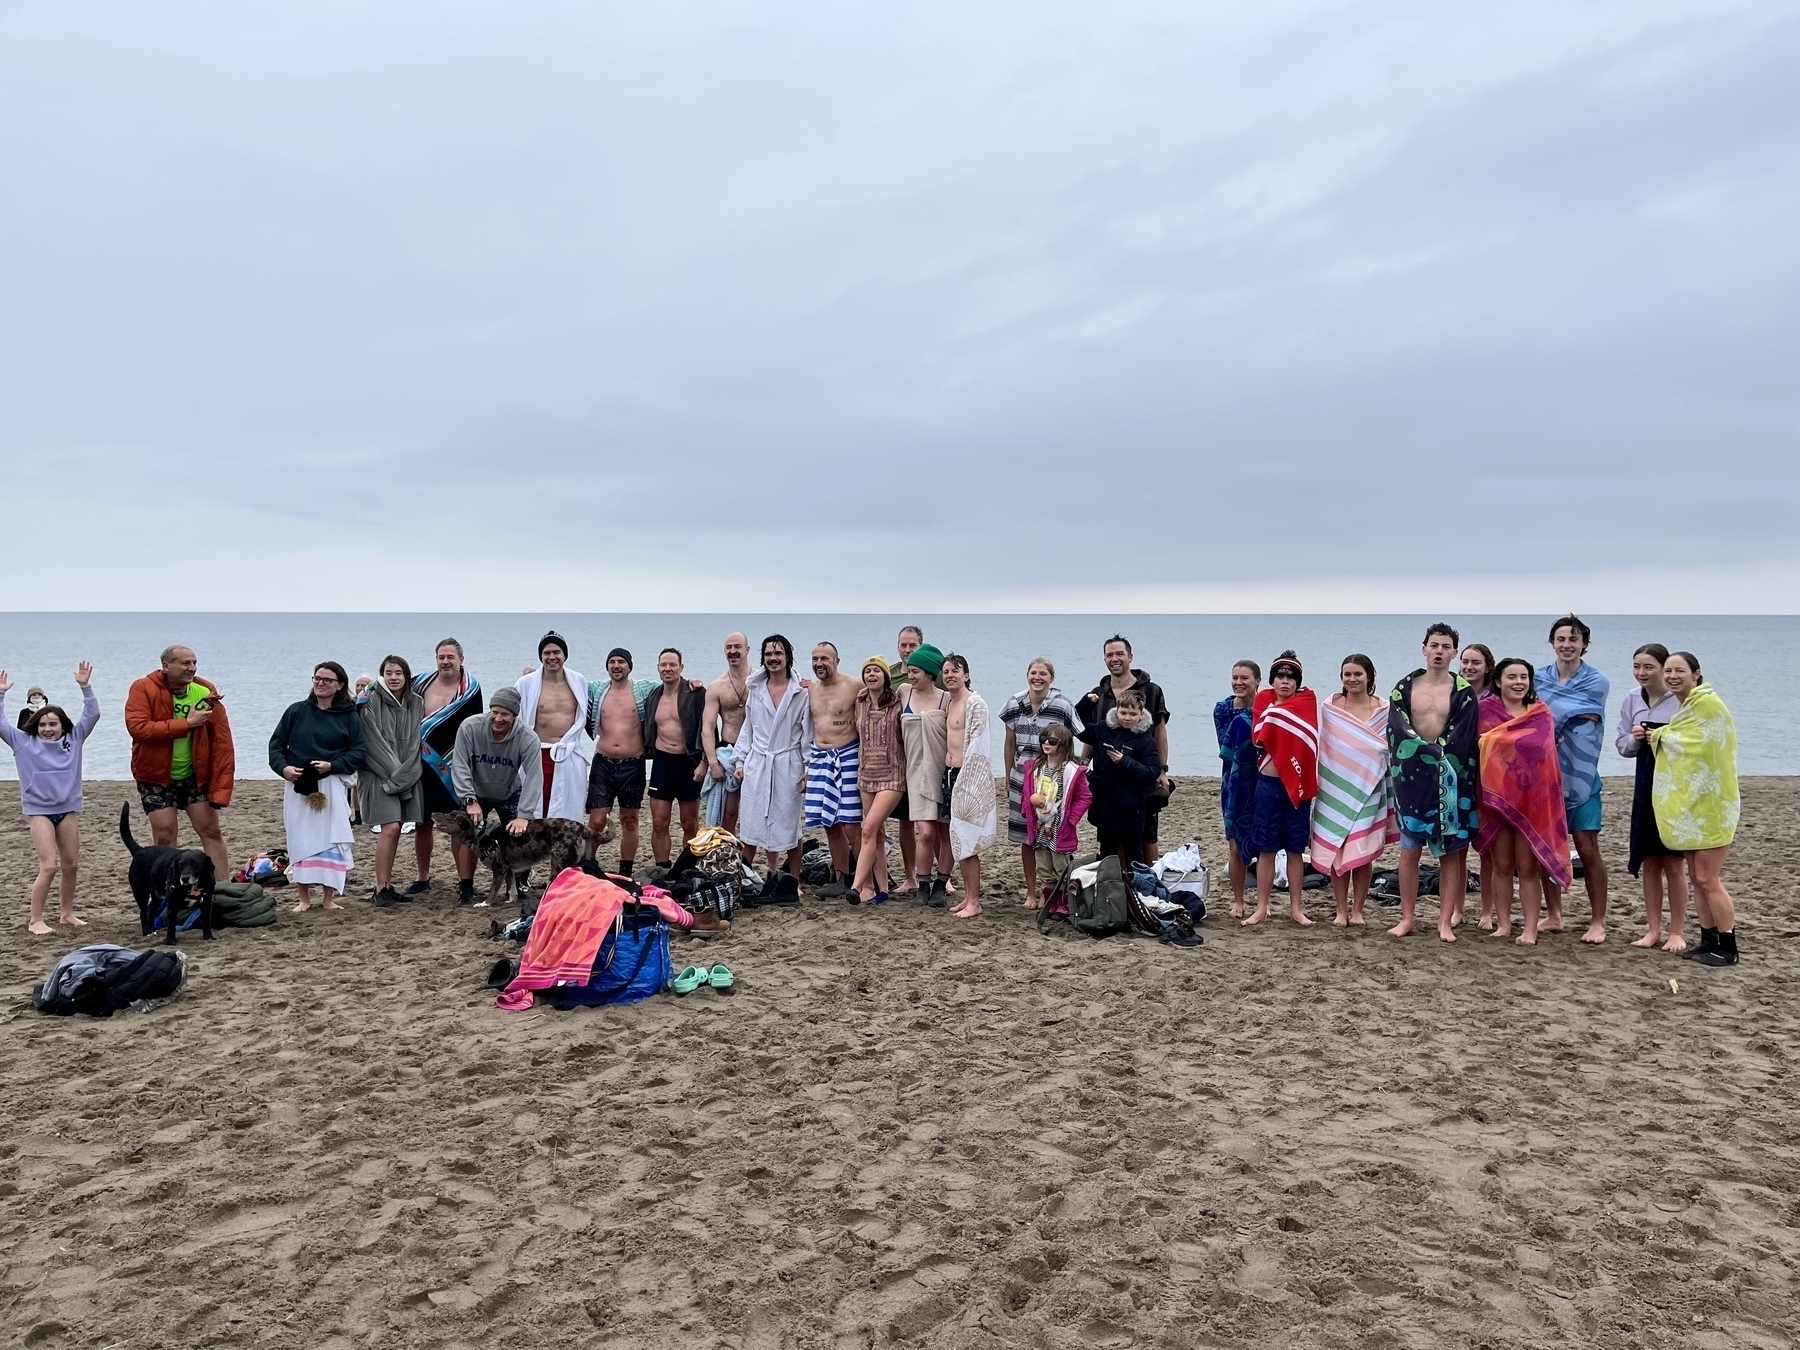
I was feeling a bit worn out. So, skipped this morning’s swim and slept in. This did wonders for my Readiness To Train score, which hadn’t been green for a week. A reminder, which should be unecessary, of the importance of rest.
Finished reading: Elder Race by Adrian Tchaikovsky. A fun read. I really liked the structure of alternating each chapter between fantasy and sci-fi, plus the story was intriguing 📚
Finished reading: Perhaps the Stars by Ada Palmer. A satisfying ending to the Terra Ignota series. I really enjoyed this series, though it can be a tough read. Jammed full of ideas and rich details, which can seem overwhelming at times. In the end, I’m not sure it was a successful novel, despite the ambition and fascinating world building📚
🎧 The Essential Sam Harris is a well done, comprehensive set of podcast episodes that dive into the details of specific topics, including artificial intelligence, consciousness, and morality. I’ve enjoyed each one, so far