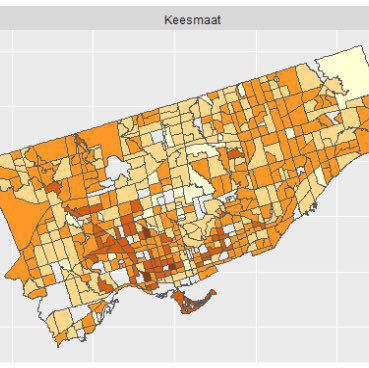
Our predictions for the recent election in Toronto held up well. We were within 6%, on average, with a slight bias towards overestimating Keesmaat’s support. Now we’ll add more demographic richness to our agents and reduce the geographical distribution of errors www.psephoanalytics.ca/2018/11/r…