evolution
- Routley M.B., Mavraganis K. & Eckert C.G., 1999, Effect of population size on the mating system in a self-compatible, autogamous plant, Aquilegia canadensis (Ranunculaceae). Heredity 82: 518–528 [link][PopulationSizeT.pdf]
- These data measured the genetic architecture of male-phase duration in Chamerion angustifolium. There are three files in the archive used to estimate genetic variances & covariances with VCE.
- protandryHeritabilityData.dat: Contains the measured data for male- & female-phase duration, flower size, & display size
- protandryHeritabilityPedigree.ped: Contains the pedigree information for the selection experiment
- protandryHeritabilityVCE: Is the VCE file that configures the analysis
Routley, M.B. & B.C. Husband. 2004. Responses to selection on male-phase duration in Chamerion angustifolium. J. Evol. Biol. in press Download paper: protandryHeritability.pdf
Download data: protandryHeritability.zip
- These data are the average seed set estimates for dichogamous and adichogamous Chamerion angustifolium at different inflorescence sizes.
- maternalID: Identification code for the maternal plant (i.e., grandmother of the counted seeds).
- individualID: Identification code of the plant.
- array#: The array identification number.
- dichogamyType: Indicates if the plant was dichogamous.
- flowerPosition: Flowers were sampled from either the bottom or top of the inflorescence.
- inflorescenceSize: The number of open flowers on each plant in the array.
- seedCount: Number of full seeds
- notSeedCount: Number of aborted seeds
- Routley, M.B. & B.C. Husband. 2003. The effect of protandry on siring success in Chamerion angustifolium (Onagraceae) with different inflorescence sizes. Evolution, 57: 240-248 PubMed PDF
- These data are the average siring-success estimates for dichogamous and adichogamous Chamerion angustifolium. Siring success is estimated from the proportion of heterozygous progeny produced at the PGI locus. Dichogamy classes were homozygous for alternate PGI alleles, so that heterozygous progeny represent interclass pollen transfer.
- Array: The array identification number.
- DichogamyType: The dichogamy status of the plants in the array.
- FlowerSize: The number of open flowers on each plant in the array.
- ProportionHeterozygousProgeny: The ratio of heterozygous to homozygous progeny at the PGI locus.
- Routley, M.B. & B.C. Husband. 2003. The effect of protandry on siring success in Chamerion angustifolium (Onagraceae) with different inflorescence sizes. Evolution, 57: 240-248 PubMed ProtandryDiscounting.pdf
- These data are pollen counts from anthers before and after single bee visits in populations of Chamerion angustifolium from Montana. Pollen was quantified with a Beckman-Coulter Multisizer 3 particle counter.
- Population: The population sampled, either tetraploid or diploid.
- Sample: An identification code representing the plant and flower sampled.
- StigmaPresence: Some flowers had their stigma and style removed with forceps. Others were left intact.
- Visitation: Whether the anther was sampled before or after a single bee visit.
- PollenCount: The estimated amount of pollen present in the flower.
Population size
The outcrossing rate is a fundamental attribute of plant populations that determines population genetic structure, individual plant fitness, and ultimately speciation rates. The outcrossing rate can be influenced by population size through reductions in both mate availability and pollinator service. We investigated the effect of population size on the outcrossing rate in 10 populations of Aquilegia canadensis in Southern Ontario, Canada.
Across a range of sizes from 32 to 750 reproductive individuals, we found that small populations (n < 35, red line) had a significantly lower outcrossing rate than large populations (n > 90, blue line).
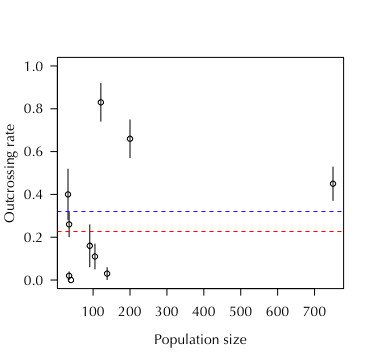
Given the high estimate for inbreeding depression in this species (0.88 ± 0.14), small populations may experience a rapid decline in population-level fitness that can lead to local extirpation. The consequences of human-induced habitat fragmentation suggest that such local extinctions are common due to this demographic effect.
Collaborator(s):
Publication(s):
Heritability of male-phase duration
Format:
Citation:
Ecology Retreat, University of Calgary
Routley, M.B. Measuring the male gain curve. Ecology Retreat, University of Calgary
The Crusade Against Evolution
An interesting read from Wired News – The Crusade Against Evolution. In addition, the Panda’s thumb has been following and carefully dissecting the recent controversy over an intelligent design paper being published in a peer-reviewed journal. The evolution-creation debate seems to be resurfacing after a short time off. The debate is important and the intelligent design supporters have to be countered, but their arguments have become hackneyed.
Pollinator networks
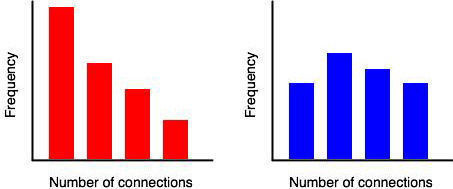
Plants are sessile and, consequently, many species rely on pollinators for mating opportunities. However, pollinators do not necessarily visit every individual in a population with equal frequency. Plant attributes, such as floral display and reward provisioning, can influence the frequency of pollinator visitation. Furthermore, aspects of population density and structure may also influence visitation patterns. One effect of this unequal distribution of pollinator activity is that pollinators create networks of connections between plants in which a few plant receive many visits and many plants receive few visits. Such networks are termed ‘scale-free’ and can be contrasted with random networks. Random networks follow a Poisson distribution of connection frequency and have the familiar bell shape characteristic of many biological patterns. Scale-free networks have power-law distributions with no peak, just a steady decline in the frequency of nodes with increasing number of connections. Technically, in a scale-free network the probability that any node is connected to k other nodes is proportional to 1/k^n^, where n is usually around 2.
Measuring networks
The hallmark of a scale-free network is a hub or node with a high number of connections. A relatively simple test for hubs is to plot a histogram of the number of connections between plants. This is illustrated in the following figures. On the left, many plants have a low frequency of connections, while a few plants have many connections. Those plants with many connections could be hubs. Contrast this with the right. The distribution of connections follows a bell shape with no plants having an excessive number of connections. There are no hub plants in this population.
Importance of scale-free networks
The analysis of scale-free networks has provided insights into fields as diverse as scientific-citation patterns, disease epidemics, world-wide-web structure, and cellular metabolism. Such power suggests that applying network thinking to pollination biology may be useful. These networks are produced through a process of growth and unequal creation of connections. Clearly plant populations experience changes in population size and pollinator behaviour often leads to 'traplining’ or enhanced visitation to particular phenotypes. Consequently, plant populations have some of the prerequisites for scale-free networks. Scale-free networks are very resilient to the random loss of nodes, because the vast majority of network function is provided by the hubs. In a plant population context, if a population can be characterised by a power-law distribution, population growth rates and persistence are likely driven by a small subset of the plants. Such an asymmetry would have important implications for evolutionary ecology and conservation questions.
An important first step is to determine if pollinator-visitation patterns follow a power-law distribution. Hub plants could then be identified and the mechanisms producing the pattern investigated. Are hubs spatially clustered? Do they have larger-than-average floral displays or brighter floral pigments? What are the demographic consequences of removing hubs from a plant population? All we need is data on pollinator visits to plant populations. The data I have access to are inconclusive, mostly because they have insufficient visit frequencies. Any other data sets would be appreciated.
For more information on networks visit www.nd.edu/~networks.
Society for the Study of Evolution meetings 2004
Routley, M.B., L.D. Harder, & S.A. Richards. Ovule fates. Colorado State University
Download SSE2004.pdf
Seed size
I have been investigating issues of ovule and seed development recently. One question that has come up is: How much variation is there in seed size? I had analysed some seed set data for some earlier work with some image analysis software. Consequently I have a large data set of seed area and perimeter for Chamerion angustifolium. A rough look at the data is:
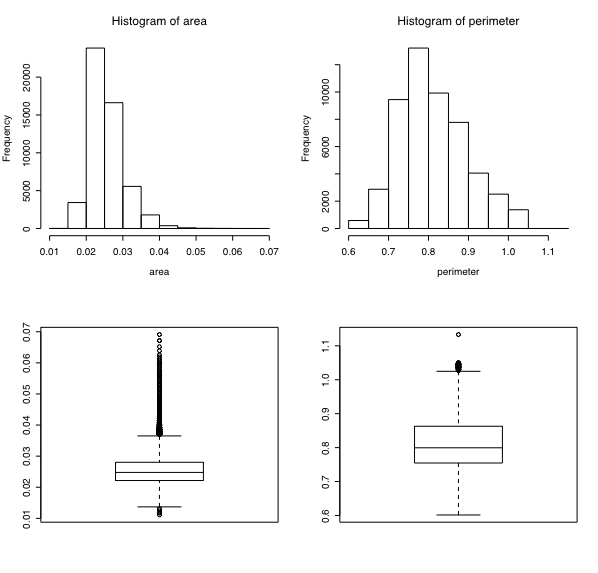
The data set is available as seedSizeData.txt.zip. Bewarned, the file contains over 100,000 lines – be sure to use an efficient text editor or stats package. All dimensions are in cm. The seed? column contains a 1 for seeds and 2 for objects smaller than seeds. See this for details.
Character assignments in phylogenetic analyses
In some recent research (http://public.me.com/mroutley/SIandDichogamy.pdf) I had to make inferences about families based on character states of the species within the family. One approach is to use a simple majority rule. For example, if more than half of the species possess character state x rather than y, then the family can be described as x. However, this approach seemed rather liberal, which led to a 2/3 majority criterion: if more than 2/3 of the species are x, the family is x; If less than 1/3 is x the family is y; otherwise the family is ambiguous.
A significant drawback to arbitrarily creating such criteria is that I had no idea what the consequences were for making Type I and Type II errors. Presumably, as the criterion becomes more stringent, Type I errors are less likely, but such uncertainty is not comforting. I decided a better approach would be to attempt a simulation study using different criteria coupled with a more sophisticated character state reconstruction algorithm.
The general approach was to create a family of twenty species and randomly assign a fixed proportion of each species one of two possible character states. The fixed probability chosen represented the decision criteria to be evaluated. For example, a 51% proportion is equivalent to the simple majority criterion. I then randomly generated 5,000 phylogenetic tree topologies for the family. To evaluate any given decision criterion, I compared the family characterization from the decision criterion to the ancestral-state reconstruction from Schluter et al’s maximum-likelihood analysis. The idea is that the maximum-likelihood reconstruction should be reasonably accurate, since it incorporates tree topology into its calculations. If the decision criterion and maximum-likelihood approaches yield similar answers, the decision criterion may be a good choice for describing families in the absence of species-level phylogenetic resolution.
I tested three decision criteria. Their results are: an 80% criterion was 98.1% accurate, 65% was 91.6%, and 55% was 60.8%. Clearly more stringent criteria are most similar to the more sophisticated maximum-likelihood analyses. However, stringency does exclude more data from the analysis as more families become ambiguously coded. A proper trade-off between stringency and sample size is required to make the best use of data.
I conducted these simulations with Mesquite and the data file is available(http://public.me.com/mroutley/simulations.nex).
Seed set of dichogamous plants
Description:
Format:
Citation:
Download: SeedSetData.txt
Ecology Division Seminar Series, University of Calgary
Routley, M.B. The evolutionary significance of being one gender at a time. Ecology Division Seminar Series, University of Calgary
Download https://matt.routleynet.org/uploads/2020/97fb2da280.pdf
Siring success of dichogamous plants
Description:
Format:
Citation:
Download:
Pollen removal after single bee visits in the field
Format:
Citation:
Download:
Floral Integration
Unrelated to my “official” thesis work, I have been thinking about floral form and its influence on plant fitness. As an excuse to start a discussion with anyone interested, I’ve posted this overview of what I hope to work on next.
Plant mating systems control the transmission of genes between generations and, therefore, are a fundamental characteristic of populations. Since flowers are the reproductive organs of plants, floral form fundamentally influences plant mating systems. However, research into floral evolution has traditionally “atomized” flowers into conspicuous traits that are then investigated independently. Despite the undeniable success of this reductionist approach, an alternate research strategy called phenotypic integration, found at the intersection of morphometrics, quantitative genetics, reproductive ecology, and plant evolution, offers a unique perspective. Floral integration, in particular, asserts that the variance-covariance structure of entire flowers, rather than mean values of individual traits, may be an important target for selection. This is especially relevant for animal-pollinated, hermaphroditic flowers (i.e., most angiosperms) in which the male and female sexual organs must be positioned precisely within the path of pollen movement. Consequently, I expect high integration for anther and stigma placement relative to, for example, vegetative characters. After a long period of neglect, floral integration is beginning to receive more attention. To date, most of this research has focussed on quantifying the magnitude of integration, whereas the evolutionary significance of variation in floral integration remains an open question.
Society for the Study of Evolution meetings 2003
Routley, M.B. & B.C. Husband. Responses to selection on protandry in Chamerion angustifolium (Onagraceae). Chico, California